
Introduction:
Because this is so personal, I’ll introduce myself. I am Robert “Bob” Bilyk, founder of LodeStar Learning. I am passionate about the project I am about to describe and a proponent of instructional technology in general.
I recently heard an interview with Christopher Kimball, formerly of America’s Test Kitchen. Two things he said that stuck with me: First, he described himself as being a home cook rather than a chef. Secondly, he talked about introducing recipes to other home cooks that were slightly out of reach of their comfort zone and knowledge but not way out of reach.
My efforts are a modest version of that. I’m interested in helping online instructors reach out and embrace new ways of interacting with their students. I’m trying to connect to that inner instructional designer in all online teachers. And I’m trying to introduce strategies that are within reach but may require a stretch.
Geolocation storytelling is one such strategy. It’s an incredible strategy that, I believe, is within reach of all online instructors. Geolocation storytelling works for a broad range of disciplines: literature, history, biology, environmental studies, communications, urban planning, and on and on – wherever location is relevant. I use the term storytelling very loosely. It can be fiction or non-fiction.
Geolocation storytelling reveals something about a location when the student visits the site either physically or virtually. The student can see or hear the narrative on her smartphone when she physically visits a site or clicks on a map marker.
In this article I intend to share a project that I’m currently working on. I intend to disclose the inspiration of the project, the brainstorming, and the nuts and bolts of how I am putting it all together. It’s not completed. It truly is a work in progress.

Screenshot of one page of a LodeStar Geolocation storytelling project situated in Arles, France, and focused on Vincent Van Gogh, the Dutch painter.
The idea
Recently my wife and I traveled to Iceland and France. We had several ideas in mind for geolocation stories — ideas that would match up to educational needs. Some of our ideas turned out to be impractical because of cell phone coverage issues. But one of our ideas hit the jackpot.
The keys to a good geolocation story are a) locations where there is a strong cellular signal b) exterior locations with line of sight to the sky for the Global Positioning Satellite (GPS) signal c) a strong educational objective that is tied to location and d) somewhere to house the project like a learning management system.
For us, all of the elements came together in Arles, France. Before arriving in Provence, in southern France where Arles is located, I imagined a GPS-guided walking tour of all the places that Vincent Van Gogh painted and sketched in Arles. But I didn’t know whether or not it would be practical.
As it turned out, it was not only a practical idea (cell phone coverage was great and the buildings didn’t obstruct the satellite signal) but one that needed to be done.
The need
I’m sure there are dozens of guidebooks, brochures and pamphlets on Van Gogh’s Arles. We didn’t immediately find any. The tourist office had a nicely illustrated guide in French, which we didn’t buy. Instead, we thought we’d start off with the obvious starting point — Fondation Vincent Van Gogh.
The mission of Fondation Vincent Van Gogh is wonderful — but it houses only a few of Van Gogh’s paintings. If you are fresh off the train, boat or motorway, full of anticipation of all things Van Gogh, the Fondation is a bit of a disappointment. (They do sell rubber ear erasers, however.)
We then thought of the next thing we knew. The Yellow House! That’s where Van Gogh stayed and painted and decorated in anticipation of the arrival of a fellow artist: Paul Gauguin.
As we soon learned, the Yellow House doesn’t exist. We asked around. No Yellow House.
Arles is a wonderful place. But it is difficult, at first, to make that Van Gogh connection. If you know where to go, you’ll find panels of Van Gogh’s work at the locations where he painted some of his most famous works. However, you need a guide to find them. Arles is a big place. The panels are helpful but you need to know something about Van Gogh to really appreciate them.
The opportunity
So here is the crux of the thing. Van Gogh painted in locations. Location — with its people, rooted in the farms and neighborhoods, its colors, patterns, streets, trees, and flora — is an important part of the story. As important is the perspective and knowledge of the educator. What the educator can bring to the story, superimposed on location, is the opportunity. In our project, visitors to Arles would be guided by the story to important places and then presented with information related to the places.
The intrepid educator
I’m not a Vincent Van Gogh scholar. In contrast, I think of the scholarship of educators with whom I have worked. I think of educators like Dr. Carolyn Whitson, at Metropolitan State University, who recently published an eBook titled ‘Understanding Medieval Last Judgment Art’* and I imagine what they could do with geolocation story telling. This strategy is within reach of educators like Dr. Whitson because she teaches online, she uses technology, and she has already embraced eBook technology (and other technologies) to make her text and photography accessible to a wide range of students. (The link to her book can be found at the end of this post.)
I’m not a Van Gogh scholar, but I am an enthusiast. Since I was a teen, I’ve been drawn to his sketches, paintings and personal life. His ministry in the Borinage coal mining district, ‘The Potato Eaters’ and the sketch ‘Sorrow’ with its accompanying tortured love story hooked me from an early age. His hope of renewal in Arles and the vibrancy of his paintings and the eventual devastation of his dreams and aspirations, in various ways, inspired me. I carved wood, painted, and wrote stories under the same melancholic humor as the artist.
And so it was with much enthusiasm that I approached this geolocation story-telling project. But recognizing that I am not a Van Gogh scholar I limited myself to these few simple elements: location, Van Gogh’s own words and paintings, photography, and (sparingly) some shared insights from an art historian, the late Jean Leymarie. I added a few details to help bring significance to the location but kept those to a minimum.
Less is More
From an instructional perspective, less is more. Writers like Leymarie can bring boatloads of insight to the subject, but what do the paintings and locations evoke in students? Too much information in geolocation story telling cuts off the blood supply. The student needs to be aware of her surroundings – with a modicum of interpretive assistance. At several of the Arles locations, what is interesting is the contrast between the scene and the paintings. How might students account for the contrast? In places, like the Rhone River, the scene is not nearly as interesting as the painting. In other places, life imitated art. The hospital garden (now the library garden) and the Cafe Van Gogh had to be decorated to match the painting. In short, geolocation can be the convergence of location, media, the educator’s perspective and the students’ own thinking and imagination.
The Nuts and Bolts
The coordinates
To produce the geolocation tour of Arles, I used the ARMaker template in LodeStar 7.3. Other tools are available that will create similar projects, but I’ll describe the tool that I designed and know.
Each page produced with the ARMaker template includes a rich text editor and geolocation fields that I’ll explain in a minute. In the authoring tool, a page looks like this:
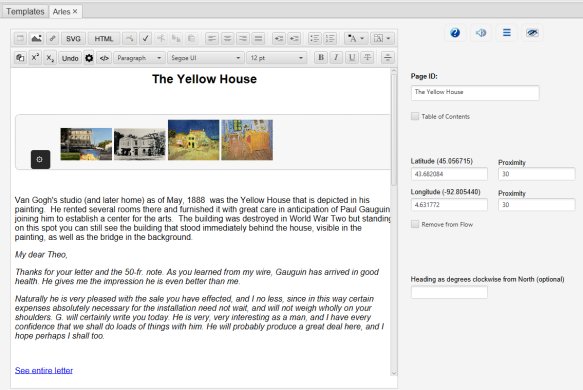
Note where the content sits, and where the coordinates are held.
To the student, the page will look like this:

The images that appear as thumbnails in the authoring tool are now rendered in full size in a slide viewer. The coordinates now appear as markers on a map.
The student can either walk to the site and have the page content called up or, if the instructor allows, the student can simply click on a marker to bring up the content associated with the marker.
In other words, geolocation story telling can require students to visit sites or it can help organize content in a virtual tour that students can take from the comfort of the library or their homes.
In our project, we actually traveled to Arles to see the sights first hand and designed the application for a guided walking tour. We meandered the streets, took photographs, took GPS readings, and absorbed the sights and sounds. But a lot of this can be assembled by the instructor without leaving her office.
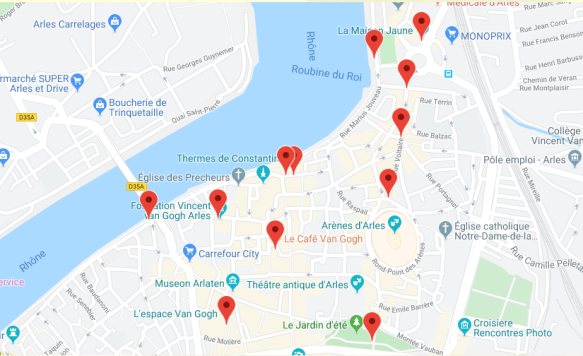
The GPS readings can just as accurately be obtained from Google Maps. In the screenshot below I invoked the popup by keeping my mouse depressed on a location.
If you are interested in this approach, bring up a Google Map, click and keep your mouse button down. If nothing pops up, click on a street away from any existing Google markers or building outlines.
The number that appears at the bottom of the popup is a coordinate. For example 43.678610, 4.630738 means roughly 43.6 degrees latitude and 4.6 degrees longitude. These coordinates have six numbers to the right of the decimal. You need this level of precision so that your coordinates fall within a few feet of your target location. Click on the coordinate and it appears at the top left of the screen, in a format that is easy to copy to your clipboard.

Google map with the coordinates popup. Incidentally, La Maison Jaune is not the Yellow House and we only encountered Gilets Jaunes once and not in Arles.
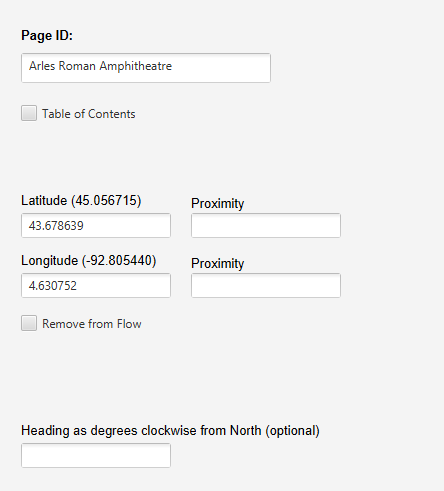
The following is a screenshot of the LodeStar page with the coordinates pasted in. The next thing to add is proximity, which means how close do the students need to be to the location before they pass an invisible geofence that triggers the display of content.
The content
The content can be in the form of audio, imagery, text, timelines, questions, and other assessment exercises.
In the following screenshot, the page features text and an inserted widget. In the screenshot below, I clicked on the black sprocket.  , which brought up all of the widgets that can be inserted into the text. I chose the image slider widget.
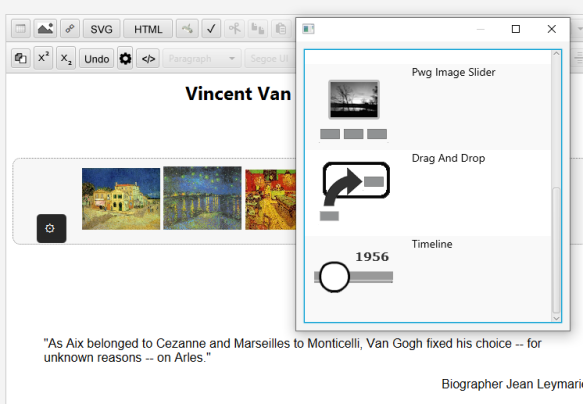
From there I could insert my images, caption them and dictate how they would be displayed – with a display list or without.

The result could be something like this:

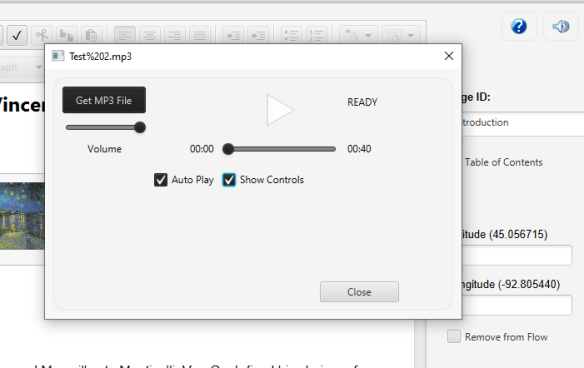
Audio can be added with the help of the audio icon at the top right of a text page and the audio dialog, which supports the import of mp3 files. (Note that auto play policies in browsers prevent the auto play of sound files unless the user has interacted with the application first. Browser policies differ.)
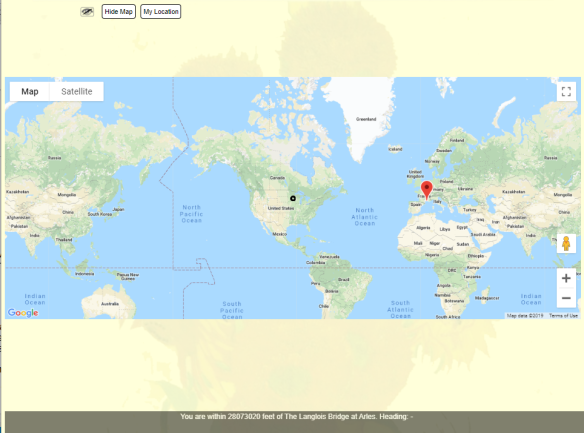
Finally, ARMaker (our template) is built on Google technology and so it supports what Google has afforded us, including the ability to map our location and mark it. In this case, I scaled way up to a global view. My current position is the black dot. Arles is the red marker. Normally, the student uses ‘My Location’ to mark how close they are to one of the locations. The screenshot below shows that I’m 28,073,020 feet away from the nearest location, which is the Langlois Bridge, on the outskirts of Arles. I have a bit of a walk ahead of me.
Google technology also allows us, in many locations, to switch to the satellite view or to drop down to the street view.
Satellite View
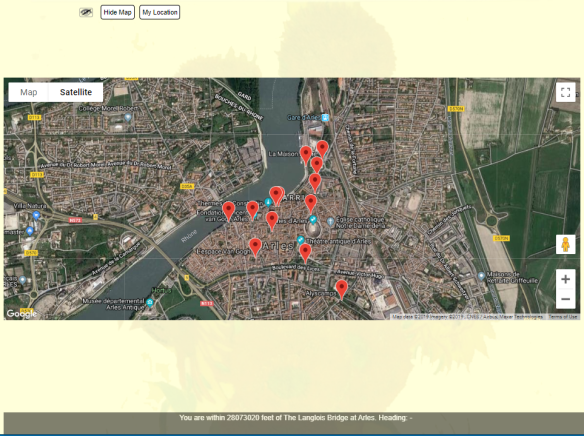
Satellite view of Arles
Street View
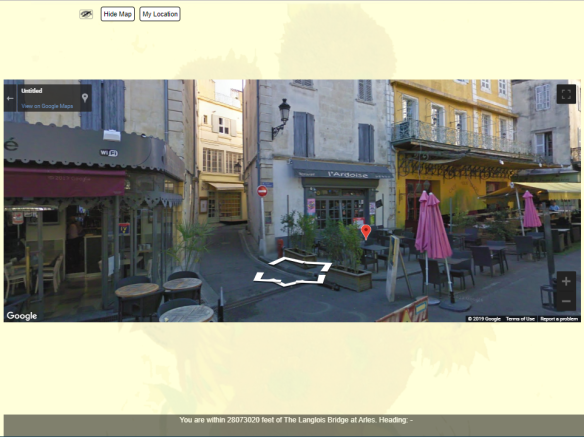
Street view of Place du Forum, in Arles
The red marker was placed on the street view by our coordinates in the LodeStar tool. (LodeStar interacts with the Google Map.) The white arrows and our mouse clicks enable us to navigate the streets. In this view, we are in the Place du Forum, which was a plaza that dates back to the Roman times. We are facing the Café Van Gogh (yellow building), which was the location of a very famous and wonderful Van Gogh painting, ‘Café Terrace at Night’, that the artist described in his letter to his brother. The second story of the Café recreates the scene of another famous painting named the Night Café. The original site, Café de la Gare, was near the Yellow House and is now gone.
Conclusion
All of this can be housed in the instructor’s learning management system: D2L Brightspace, Moodle, Blackboard, Canvas, Schoology, wherever. In fact, in order for the application to be able to receive location data, it must be launched from an address that begins with HTTPS// The ‘s’ means secure. All learning management systems use this protocol to secure student data.
So technical stuff aside, imagine the possibilities. With the combination of location and the instructor’s perspective or prima facie information shared through text, imagery, and audio, educators can use geolocation storytelling to transport their students to another place or they can get online students out of the house and into a neighborhood location that is of scientific, social, historical or artistic interest.
Again, the possibilities are endless.
As for ‘Van Gogh in Arles’, this project will be completed and published shortly after Thanksgiving, 2019. You won’t need to go to Arles to view it — but I highly recommend the trip.
References
- Dr. Carolyn Whitson, https://www.amazon.com.au/Understanding-Medieval-Last-Judgment-Art-ebook/dp/B07XBQ63VG
