Robert N. Bilyk
President, LodeStar Learning Corporation
Introduction
Natural experiments provide a unique opportunity to gain insight from the effects of naturally occurring phenomena such as new policies, environmental hazards, public health interventions, and other changes that are outside the control of the investigator. This post briefly introduces a natural experiment in online education, summarizes a key finding, and then provides a detailed set of strategies to address the finding.
Background
During my time as Director for the Center for Online Learning, I was privileged to contribute to a research article authored by Dr. Reynold Galope and Dr. Daniel Woldeab, titled Exploiting a natural experiment in assessing student learning outcomes in public and nonprofit administration: A demonstration1.
The research paper describes a natural experiment to investigate whether online graduate courses are, at least, on par with their face-to-face counterparts.
Natural experiments exploit naturally occurring opportunities for comparison. For example, a natural experiment might compare different regions with varying levels of exposure to lead or air pollution to provide insights into the impact of pollution on health. Obviously, it would be unethical to expose one population to increased lead or air pollution levels in a traditional experiment. When the differences happen naturally, researchers can study the impacts.
When investigating the effectiveness of online learning compared to face-to-face, researchers are challenged to filter out the student characteristics that lead them to choose online courses.
In our research the independent variable was the course mode – online versus face-to-face – and the dependent variables were student scores related to several outcomes. In research, the causal effect of an independent variable must not be confounded by other factors. Online can’t be considered better than face-to-face if online courses are selected by smarter, more organized, and more confident students. The research design must eliminate rival explanations for the outcomes.
Our Natural Experiment – Lessons Learned
Our natural experiment benefited from a unique situation in Metropolitan State University’s Master’s program for Public and Nonprofit Administration (MPNA).
The situation was that all newly admitted MPNA graduate students were required to register for MPNA 600 in their first semester. MPNA 600 teaches research methods and statistics. In the year of the research study, the course was offered in an online format in the fall and as a traditional, face-to-face course in the spring of the same academic year. Both versions of the course were taught by the same instructor.
The researchers didn’t have any reason to believe that students who were admitted in the fall were any different from those who were admitted in the spring. As the authors stated, one group was unlikely to be more intelligent, more motivated, more experienced, or more technologically savvy than the other group. In short, this unique situation (wherein the department required students take the course in their first semester and the two versions were taught by the same instructor) rules out several confounding variables.
You can read the research paper to learn more about student outcomes in each of the course delivery modes. For the most part, the two formats were statistically equivalent. One of the outcomes of the course was a research paper. In terms of its quality, online students performed better. But in statistical analysis, the technical part of the applied research methods course, face-to-face students performed better.
| Outcome variable | Completely face-to-face | Completely online | Difference in outcomes | p-value |
| Statistical Data Analyses | 93.6 | 89.0 | 4.6 | 0.0350 (significant at the 5% level) |
It is the latter that interests me the most: the lower score in statistical data analyses for online students. I believe this uncovers online learning’s untapped potential.
In the past, I’ve often been surprised by studies that also show no difference in student performance between online and face-to-face courses. I’m surprised because I’ve observed that many of the opportunities for deep, significant learning in online learning are simply missed.
In my view, asynchronous online learning has its advantages. Students can choose when to study or when to read or watch presentations. It’s convenient. They save time by not driving to class, looking for parking, walking across campus. They can turn up the volume, drink coffee to stay awake, take care of the kids, participate in online discussions, post questions, reduce their exposure to embarrassment, avoid discrimination, look up prerequisite information, and so on.
Face-to-face, of course, has its own advantages. It imposes an order that learners who aren’t self-directed or poorly organized benefit from. You must be in class and complete examinations at an appointed time. It offers the opportunity to discuss topics with others at the same time, in the same location. It offers good teachers the opportunity to practice a variety of instructional techniques in their comfort zone: warm-up, cool-down, humor, Socratic method, pair and share, and more. I’m not suggesting that any of these things can’t be done online. In my experience, too often, they simply are not done online.
More to the point, we have a great opportunity for online to promote deep learning of difficult concepts.
Here is a sample listing of what can be done online to promote an understanding of statistics and research methods. I’ll tease out two topics in statistics to illustrate my points: confidence intervals and sample error.
Addressing the gap: Online strategies to promote learning
It’s not uncommon for online instructors to create a resource module and include a list of resources for their course. The following strategies raise that practice to a higher level. These are resources that are carefully selected and organized with instructional intent to promote understanding, application, analysis, and synthesis. I’ll show concretely how this can all work together for the benefit of the student.
Also, these strategies apply to any online course. Because of the study, I’m using statistics to show concrete examples, but the overall strategies are important for all subjects.
I will arbitrarily pick out a couple of topics in statistics that are often germane to understanding statistical analysis. The first example is confidence intervals.
Let’s identify the various strategies to promote understanding of confidence levels and drill deeper into some of them.
- Online Tutorials
- Interactive simulations
- Data Visualization tools
- Word problems
- Online forums
- Case Studies and applied examples
- Open Educational Resource textbooks
- Gamification

Online Tutorials
The online instructor can curate online tutorials that cover confidence intervals. A Khan Academy video, for example, jumps right into the mathematical procedure for calculating confidence intervals. Dr. Nic’s Math and Stats offers an overview of the purpose of confidence intervals.
If confidence intervals were prerequisite knowledge, in a face-to-face course, I might be embarrassed to stop the professor and ask for the meaning of a confidence interval when it came up in their lecture. Even if offered, any explanation would only be understood if I understood these prerequisite concepts:
- Sampling error
- Variation
- Standard deviation
An online instructor can do an analysis of the topic and offer online tutorial resources that not only cover the topic but its prerequisite concepts. One might object that this can go on indefinitely. To understand standard deviation, you might need to understand variation, mean, and so forth. Oftentimes, however, the tutorials do cover the prerequisite information. Dr. Nic’s Math and Stats is a good example of that.
Properly selected and organized, these resources can be a powerful tool. Dr. Nic provides the conceptual background. Sal Khan provides the step-by-step calculation.

Interactive simulations
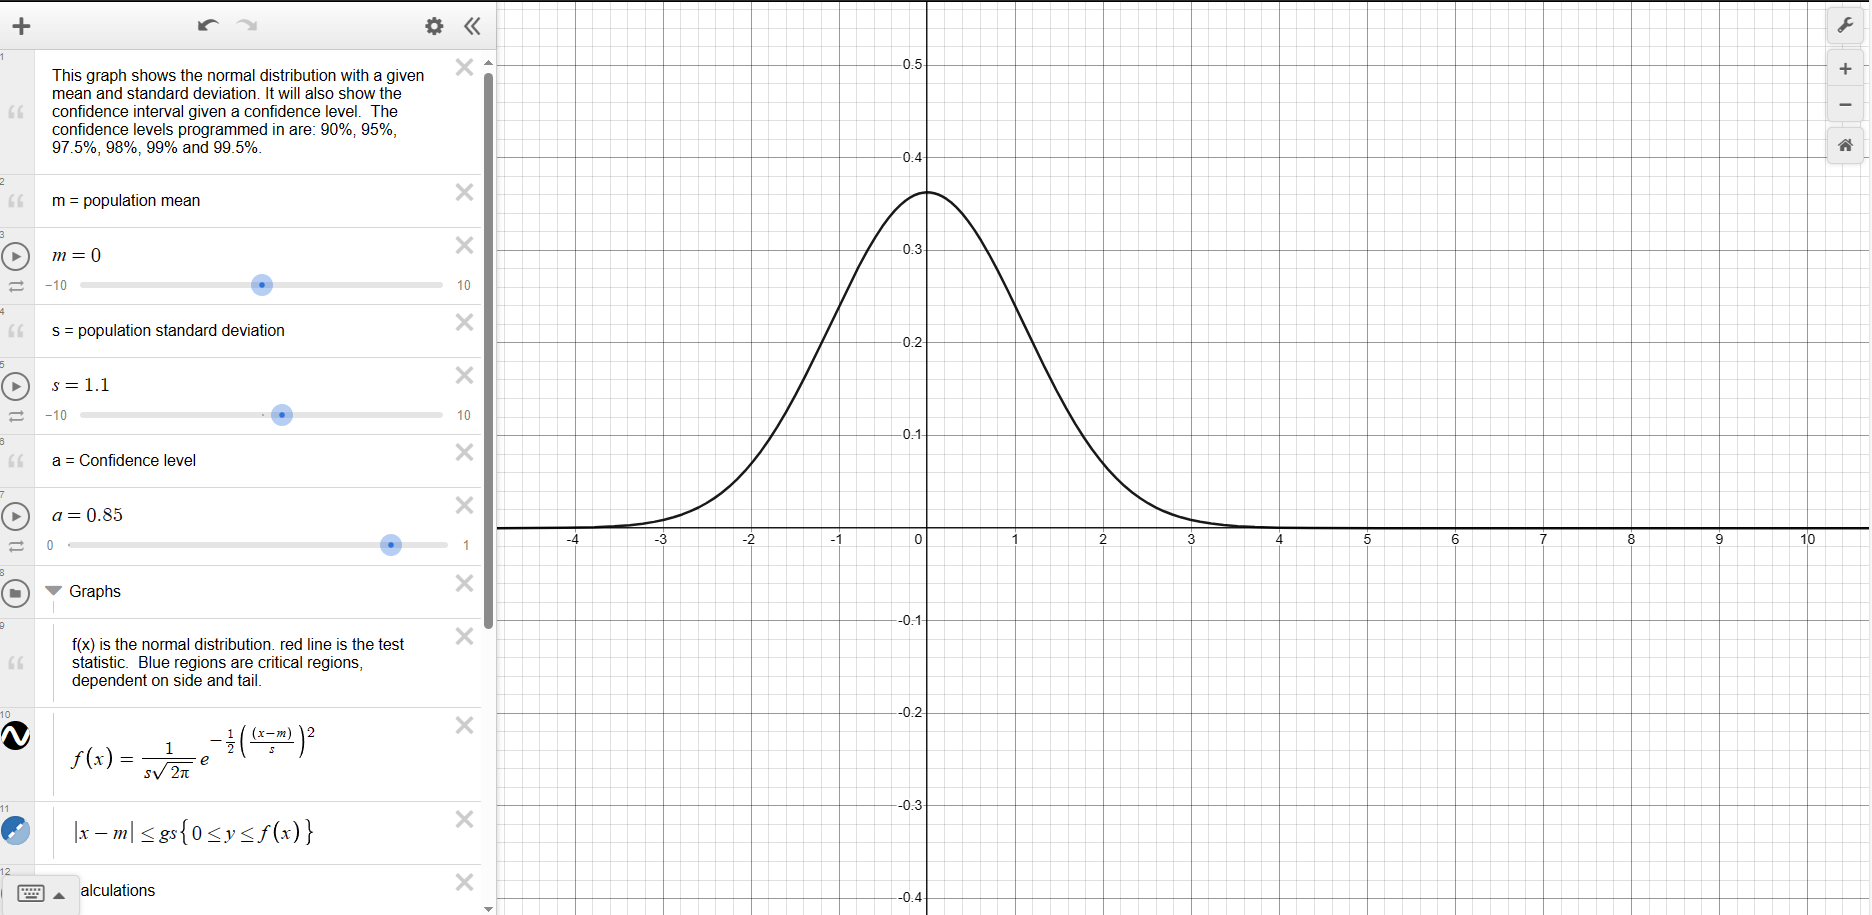
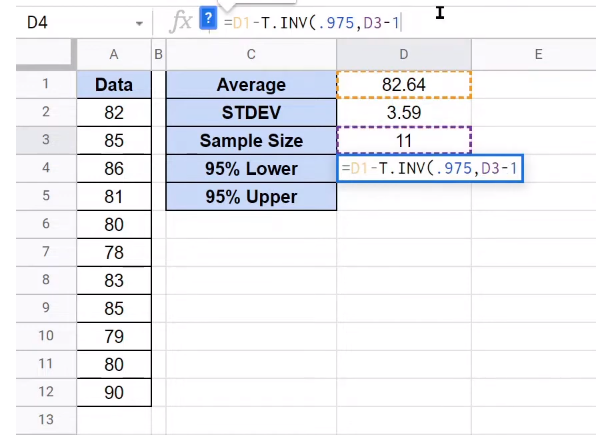
Desmos, an interactive learning platform, provides a fun way to play with statistics. For confidence intervals, we can use a graph to see the confidence interval shrinking as the standard deviation is lessened. Wide variation requires a wider range to maintain the same level of confidence. Rather than just staring at a math formula, the student manipulates parameters to gain an understanding of how measurements like sample size, standard deviation, and confidence interval are interrelated.
Tutorials combined with simulations provide us with a basic understanding, a procedure to calculate confidence interval, and an interactive to display how changes in standard deviation, and sample size can affect the interval size.

Data visualization tools
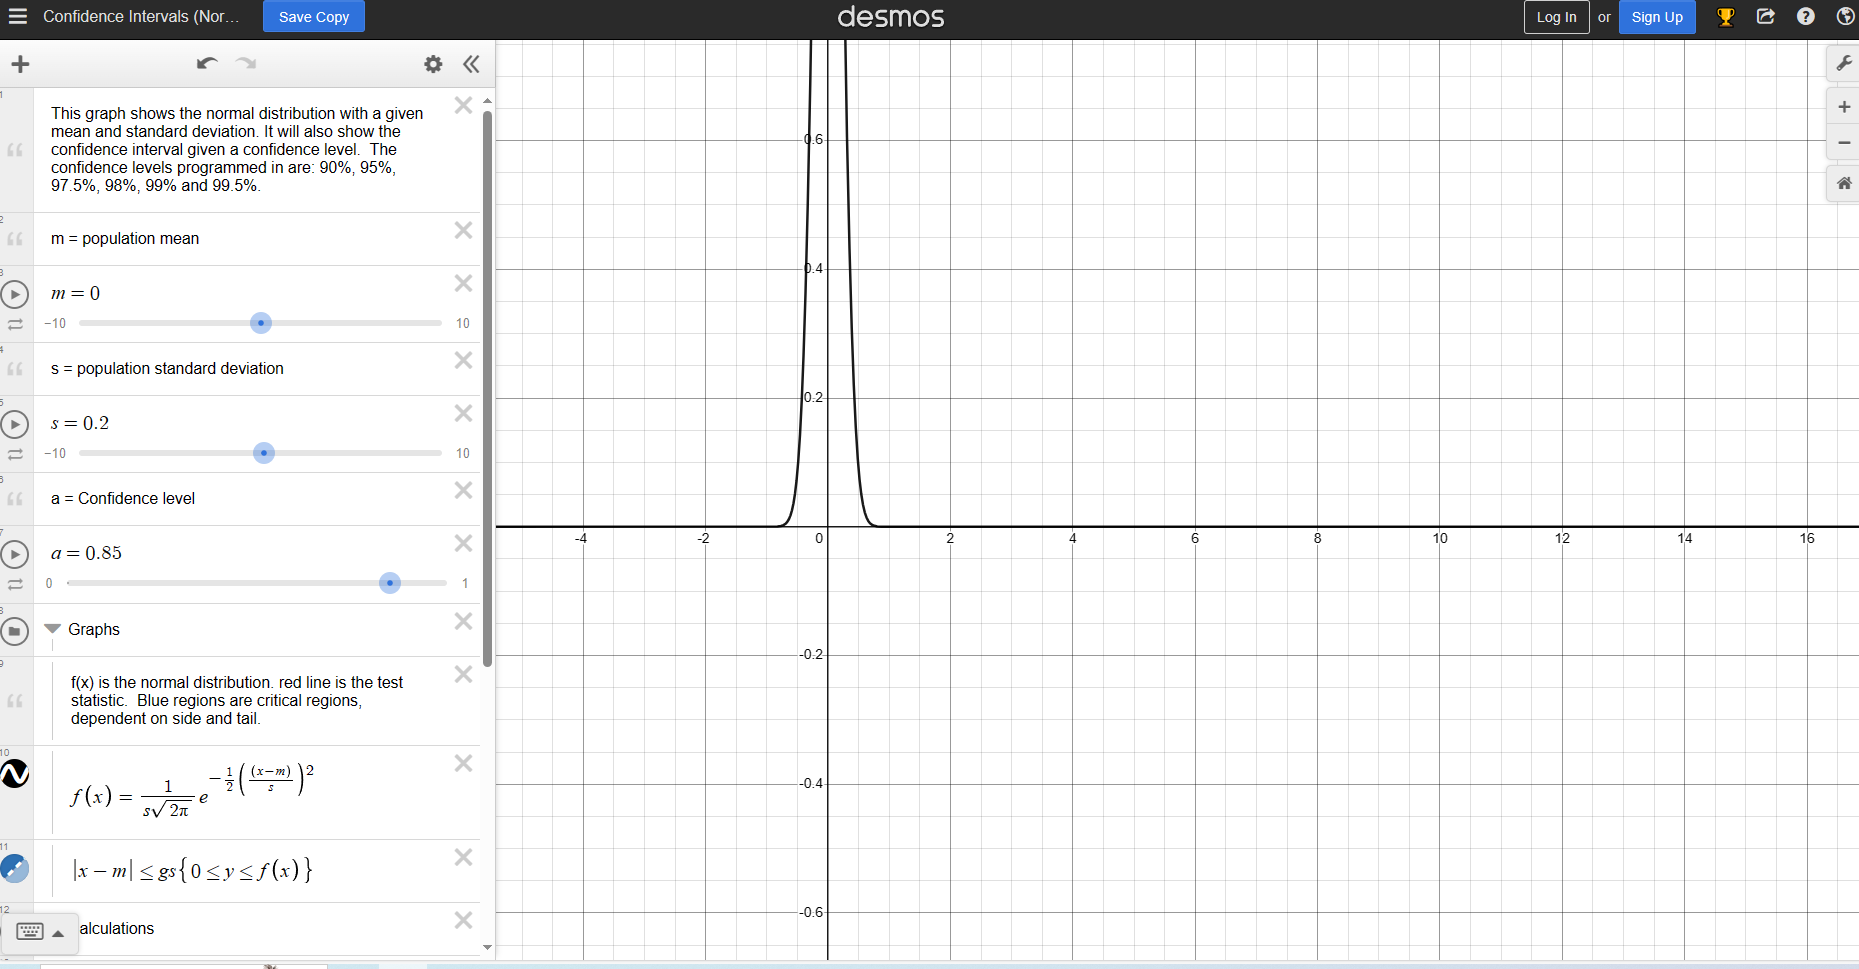
Tools like Tableau, Power BI, and Google Data Studio enable students to create interactive and dynamic visualizations, helping them understand how to represent and interpret data effectively. Available to any student is Google sheets. Google Sheets provides statistical functions to create your own confidence interval calculator and plot out the outcome in a graph. These activities lead to a conceptual and procedural understanding of the topic.
For example, Google sheets has the t.Inverse function that gives the t value for sample sizes less than 30. With Google Sheets a student can create their own confidence interval calculator.

Real data sets
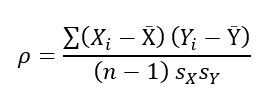
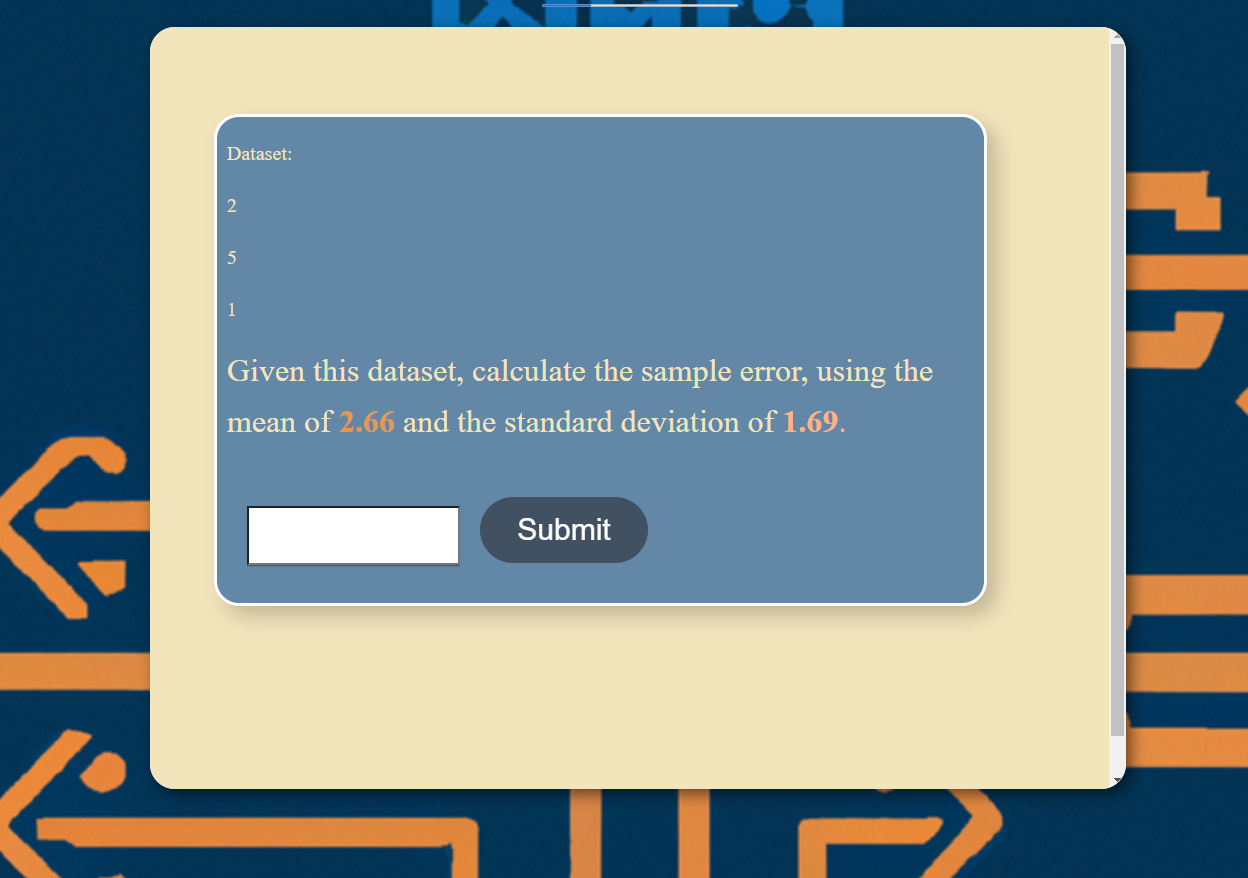
Kaggle is one site that provides real data sets from a variety of studies. An example would be a data set of students with both test scores and reported numbers of study hours. The online instructor can devise an assignment that requires students to calculate a correlation coefficient between study hours and scores.
Or the instructor can ask students to take samples from subgroups and calculate intervals that gives us confidence that the sample mean is within range of the true mean. Both these activities reinforce the concepts and procedures.

Word Problems
As stated in How Learning Works2, to develop mastery, students must acquire component skills, practice integrating them, and know when to apply what they have learned.
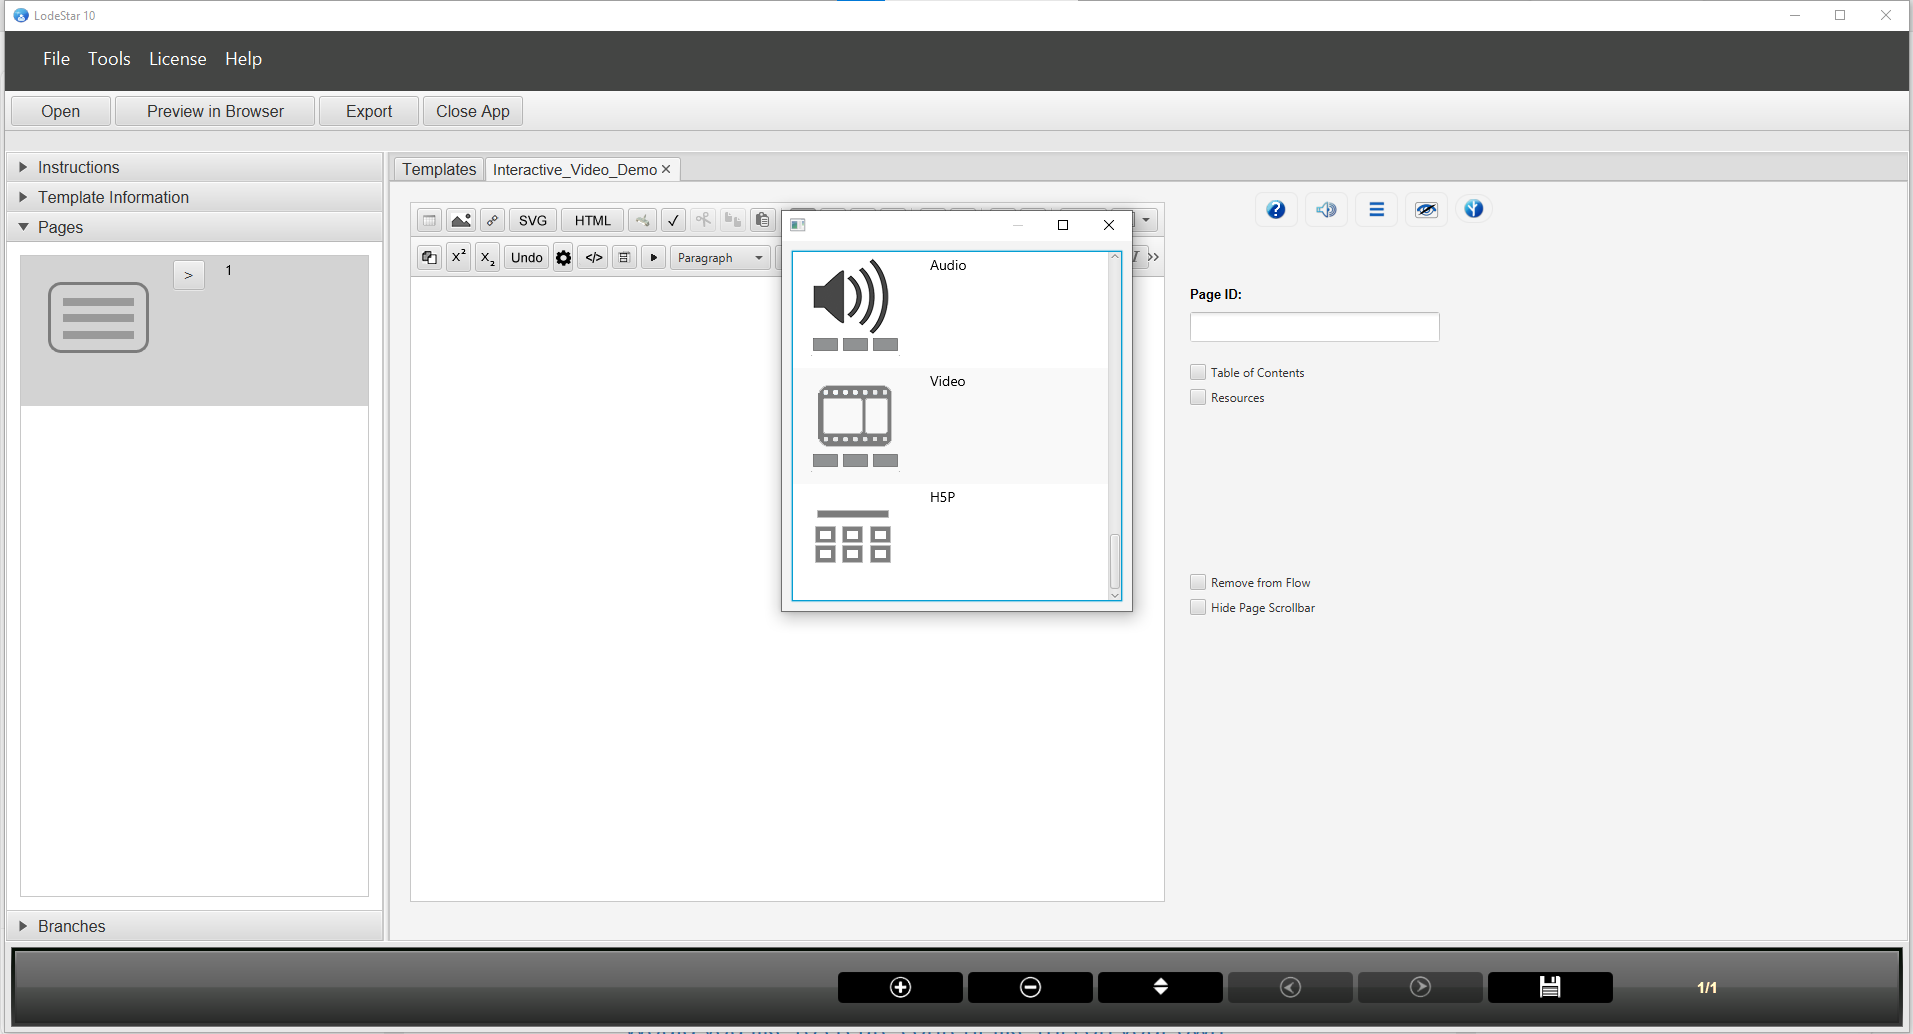
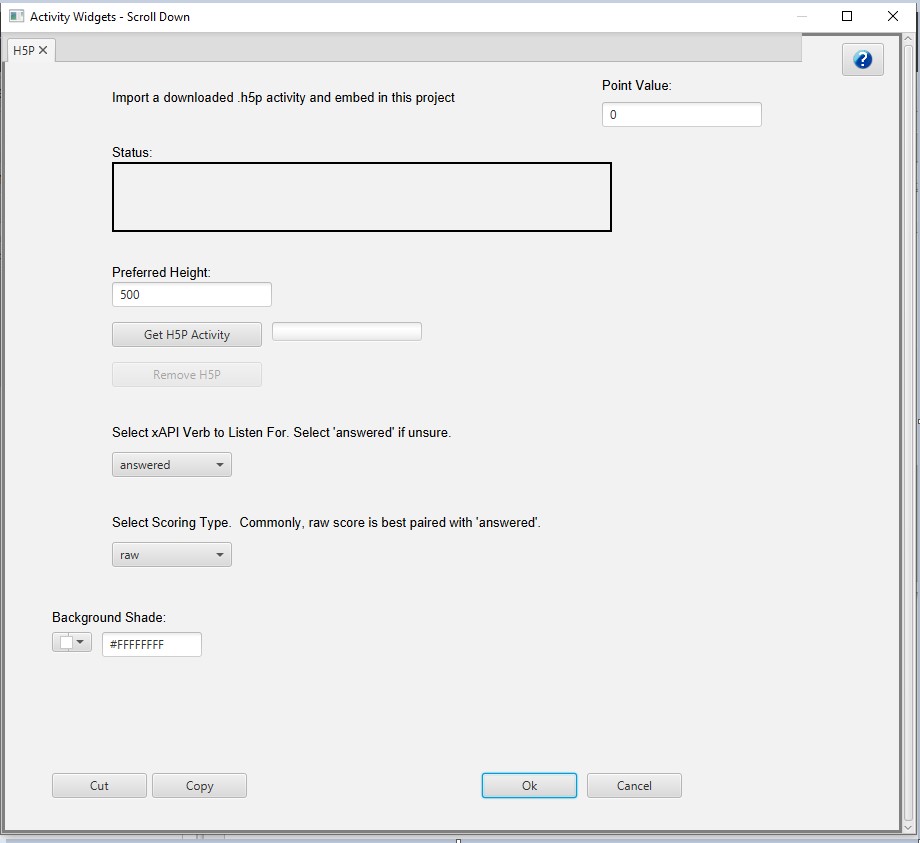
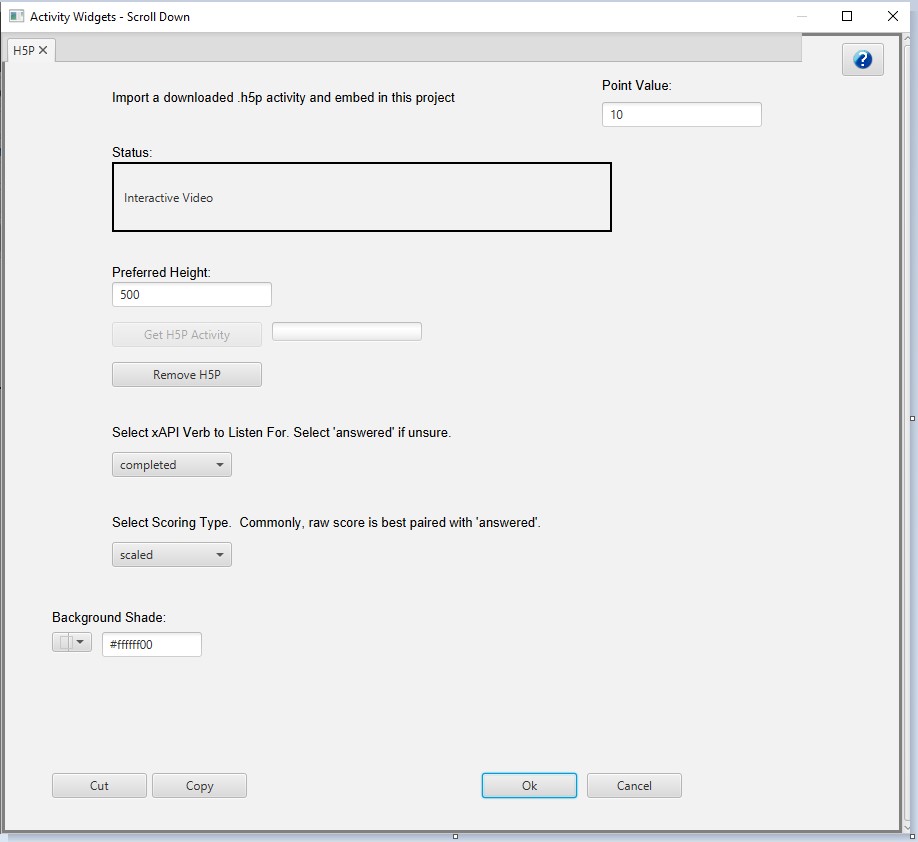
Here is where interactive word problems can excel. With tools like Storyline, Captivate and LodeStar, an instructor can easily set up word problems that are randomly generated and present a different problem to the learner on each visit.
I believe online instructors should learn an authoring tool and deepen their toolchest of strategies. I write this not because I build authoring tools. Conversely, I build authoring tools so that instructors can deepen their toolchest of strategies.
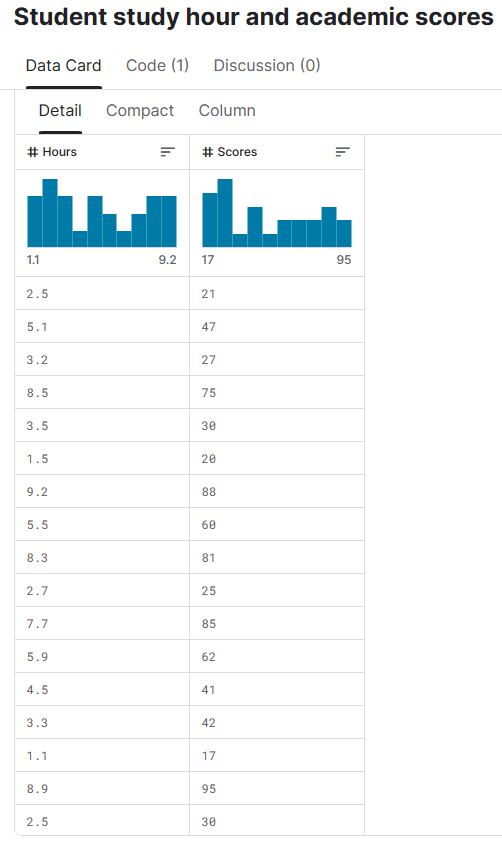
In this example, using LodeStar, the author follows an elaboration strategy. The target skill is the ability to calculate standard error given a dataset. In the first problem, the dataset is limited to three numbers. The mean and standard deviation are given. The student must divide the standard deviation by the square root of the mean and present a number with two digits of precision.
In the second problem, the author hides the mean and standard deviation. The student must calculate those values from the dataset.
In the third problem, the author presents a slightly larger dataset with no other values shown. The student must calculate the mean, then the standard deviation and then the standard error.
When a student answers incorrectly, the problem is shown again with a new set of numbers.
There is a variety of additional resources that an instructor can organize online. They can include links to online statistical tools, online statistics community forums, OER textbooks, podcasts, online statistics quizzes, and games. I’ll dive into the last one.

Gamification
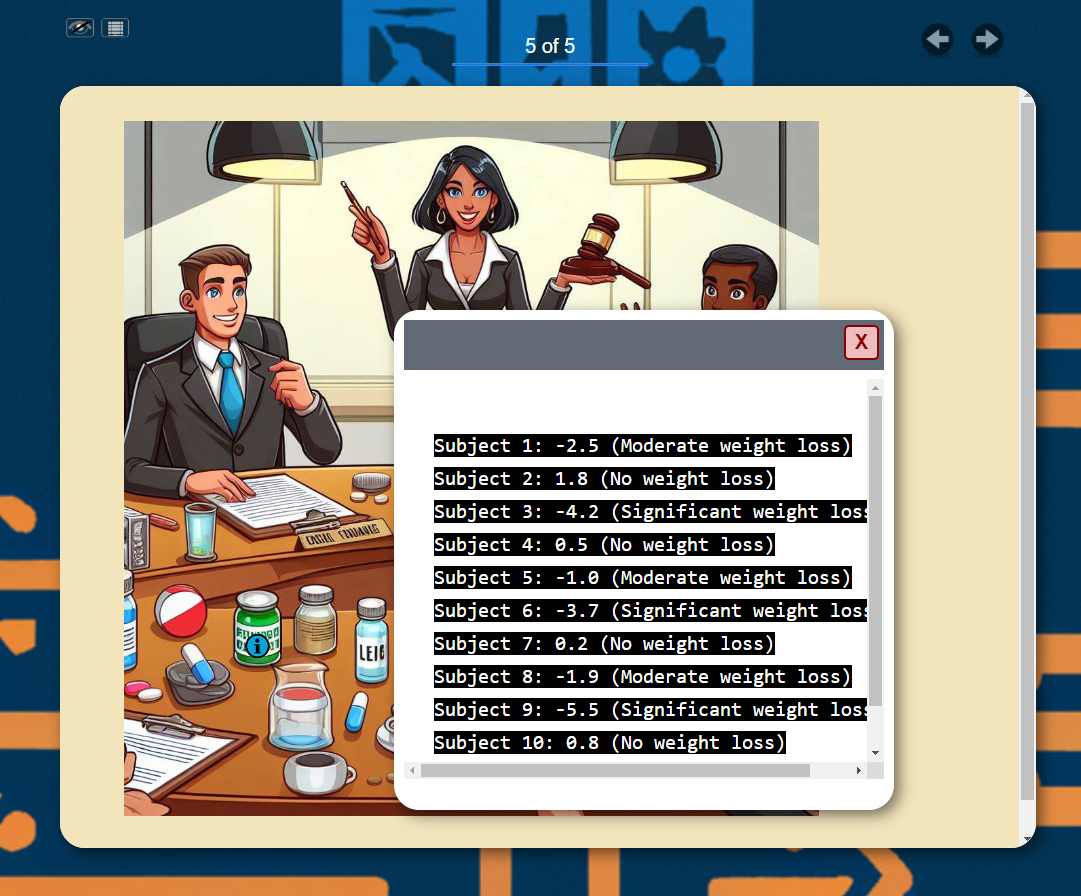
The screenshot below shows a mock-up of a game that places the learner on a pharmaceutical board where they must decide what experimental diet drug to support and fund. Each drug is tagged with an information icon that displays a set of data from a clinical trial. The learner must apply statistics to determine which drugs have been effective in reducing weight. In the end, the learner’s statistical analysis is compared to that of the expert’s analysis. The game can offer three levels, each level representing an increase in challenge.
The game can be entertaining, but it can also be an opportunity to integrate concepts that include central tendency, variance, standard deviation, confidence intervals, comparison of means, p-value, and more.
In summary, online modules can practice students on component skills and then offer gamified environments or simulations that combine component skills.
Conclusion
Our natural experiment showed that online learning students performed more poorly than face-to-face students in the technical area of statistical analysis. I outlined online strategies that can close the gap in performance.
We must continue to help faculty categorize student outcomes and decide what activities are best suited to promote those outcomes. One video might help us to get a birds-eye view of a statistical analysis: its purpose, its related concepts, and procedures. Another video might help students walk through a calculation of the statistical measurement. The two videos align to different student outcomes.
We must also reinforce some basic principles of how learning works. One activity might practice a student on a component skill; another activity might help integrate several component skills. One activity might be a word problem with changing values; another activity might be a case study that involves multiple calculations and a holistic understanding of statistical concepts.
Online learning attracts students for a variety of reasons, including its flexibility. I look forward to online learning fulfilling its original promise of individualizing instruction and adapting to learner needs.
Ultimately, online learning versus face-to-face may prove to be a false dichotomy. Real-time lectures are being zoomed into the home; online strategies are already supporting flipped classrooms. The strategies presented in this post will certainly improve online learning and, possibly, all modes of delivery.
References
- Galope, R., Bilyk, R., & Woldeab, D. (2023). Exploiting a natural experiment in assessing student learning outcomes in public and nonprofit administration: A demonstration. Teaching Public Administration. https://doi.org/10.1177/01447394231223071
- Ambrose, S., Bridges, M., & Lovett, M. (2010). How learning works: 7 research-based principles for smart teaching. John Wiley and Sons.