By Robert Molenda
Introduction
In this article, I write about augmented reality and geolocation storytelling. I dive into the details of how I created the latest augmented reality/geolocation story in celebration of the 150th anniversary of the Stillwater fire department. I purposefully cover this in great detail for the benefit of anyone who wants to get started with this new medium.
Augmented Reality or geolocation storytelling often begins with curiosity. My latest tour was inspired by questions like: ever wonder what it was like to be a firefighter? How were fires handled in 1880? How long did it take to get the horses ready to pull the steam pumper? What did it sound like back in 1890?
The Fire Run Tour of Stillwater is the most recent Augmented Reality tour of this quaint city in Minnesota. We will show you how this tour was done using the LodeStar ARMaker Template. This will get you started on making a historical tour of your own unique place.
First a little background
Lens Flare Stillwater is a “not for profit” project under the fiscal sponsorship of The St. Croix Valley Foundation. It is all volunteer and provides historical content about Stillwater for its web site and the App Store. It offers the first Augmented Reality tour in the Midwestern United States. Its goal has been to get people in the community to work together and have fun with history.
Why Stillwater?
Stillwater is the oldest city in Minnesota. It is rich with the history of the lumber industry, the St. Croix River, the railroad industry, the territorial prison, manufacturing of steamboats and steam engine tractors. The local library, the local historical society and the state historical society are great resources from which to draw content. In particular, the St. Croix Valley was blessed by the presence of an early photographer, named John Runk. Mr. Runk is responsible for a photographic record of the area that includes his own photographs as well as photographs taken by others before his time. More importantly, he documented all these photographs and left them to all who come to the valley. Stillwater also has good data signal strength and receives precise GPS signals, important to geolocation storytelling.
The Five W’s of History
We start with the Who, What, When and sometimes the Why of a story. History and photographs always take place at some location to answer the “Where” question. We will be using GPS coordinates to do some amazing things, using the ARMaker template of the LodeStar eLearning authoring tool, produced by the Lodestar Learning Corporation.
It turns out that only some of the historical local artifacts (The “What”) are still actually present for anyone to enjoy. Most of the historical buildings, locations and artifacts are no longer here. What we can do with a little work is to show others where these buildings and artifacts were located and what they looked like; then use some technical magic to excite the imagination of any visitor as they walk nearby these unique locations. Imagine walking by a location and have a historical story, picture and sound pop up out of your smart device as you cross an invisible fence that surrounds this site? This constitutes the “How” part of the adventure.
The How?
The “How” is where Lodestar Learning Corporation comes into the equation. Lodestar Learning Corporation has written software that allows all these magical things to happen within your smart device. One way to look at this is that our team of local volunteers take care of the Content, while Lodestar Learning Corporation provides the “How”, the software and technical pathway to bring the content to life on your device. LodeStar has made countless improvements to their product during the past six years. The reliability of the APP has been outstanding even during times of heavy use.
Lens Flare Stillwater is using the ARMaker template of the software. The AR stands for “Augmented Reality”. This means that the coordinates of your device location will trigger a response that will provide enhanced information about that location. In the case of Lens Flare Stillwater, we want location to trigger the opening of graphic, text and audio files related to each historical site along the tour.
How To Organize a Tour
It is important that we organize the tour in a manner that allows users to navigate it by themselves. The tour will be available 24 hours per day, 7 days per week, and it can be used on-location or anywhere in the world on any device. This is scary stuff! The power of the web always amazes me. You can go from nothing to worldwide activity. This ability carries with it a lot of responsibility.
There is a mapping function in the software that shows the path of the tour along with map pins that identify the various points of interest along the tour route. The pathway can be straight with branches or a circular route. We have used bicycle trails (circular), historic streetcar lines and a pathway that takes a fire engine route to historic fires in Stillwater.

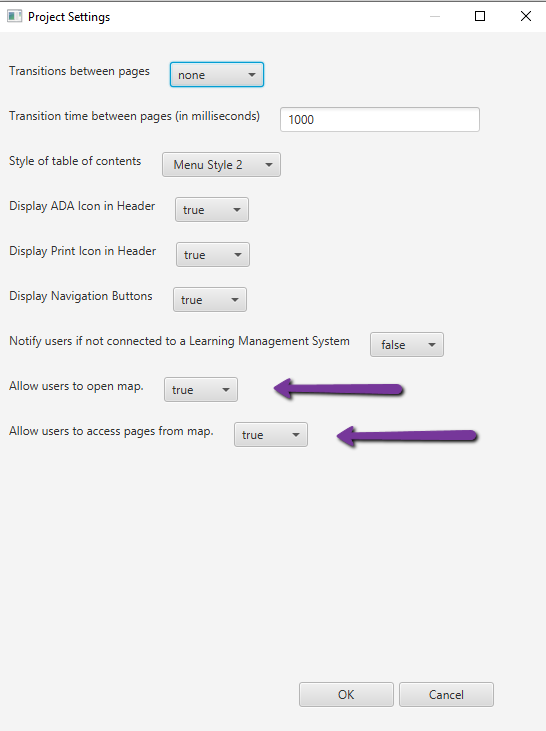
The “Show Map” button is always located on the upper left part any user’s APP screen. The tour can be taken virtually from your armchair from anywhere in the world and this map can be used to see the various points of interest before a visitor ever comes to Stillwater. For the “Augmented Reality” Tour, when users physically visit an historical location, the information comes to their devices automatically.
What is Different about the APP?
The LodeStar software functions on any mobile device, tablet, or computer. The project can be played back in a browser on all devices (i.e., browser-based) or as a mobile app on an IOS (i.e., iPad, or iPhone) device.
All of the Tour APPS for Lens Flare Stillwater can be secured from portals that are FREE to anyone. Again, the advantage of browser-based APPs is that they function on all devices and that they can be secured directly from a Web Site. We can launch the site from a printed ticket with QR code or an electronic Ad. Apps can also be saved to your screen for future use.

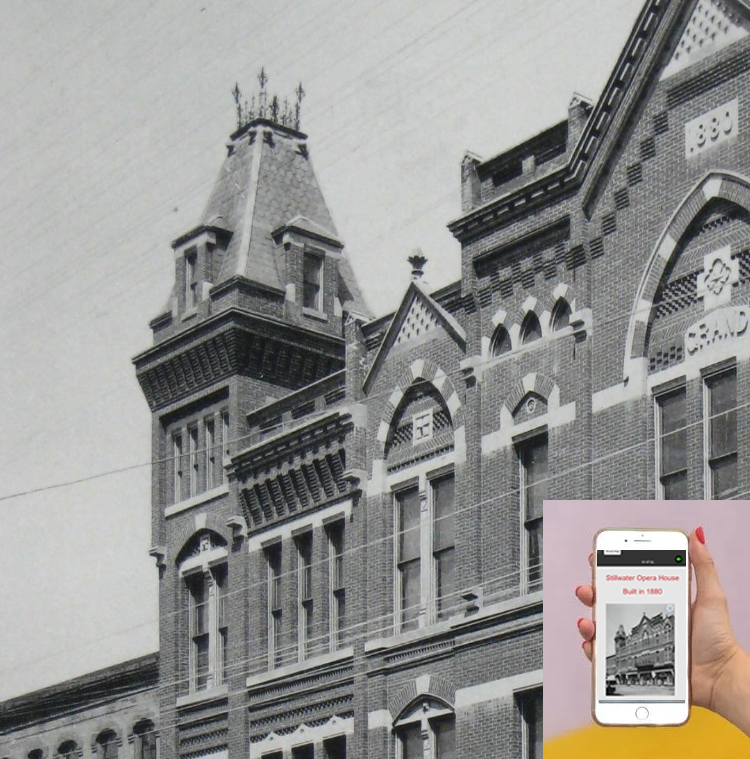
In the case of the Fire Run Tour of Stillwater, a user can go directly to the APP by scanning the QR code, which is sourced from a “Free Ticket”, directly from a printed Ad, or even from the photo above that has the QR Code.
The real magic of the Lens Flare Stillwater Tours takes place when you are actually near the historic locations. Your mobile device already knows its location and whenever it enters a new historical site it signals the system to send information to the device that is related to the new location. If your mobile device is paired to your automobile radio, your passengers can take the tour from the comfort of your automobile while you safely drive them and listen to the sound files from your radio. Another way to look at the tour is that the technology allows you to carry the history of Stillwater in your pocket or purse.
How Can Anyone Organize Such a Tour?
As mentioned, this year is the 150th Anniversary of the Stillwater Fire Department. In honor of this event, we put together a tour of Stillwater that features photographs of early fire stations, buildings, stories, sounds, building permits, fire reports, newspaper articles and photographs of fires that changed the city. There are fifteen active locations on the Fire Run Tour. Each location has its own LodeStar Page. A Page can have many photographs, stories and links. Each Page is linked to its own unique location and sound characteristic.
Organizing Content
The first task is to organize our content and start to put together some kind of pathway/story through the city. This gives us a general outline of the map of the tour from which we can obtain more precise latitude and longitude coordinates for each of the historical locations. These will be used for filling in the various fields that are part of the software. Our content will include photographs (jpeg, gifs or png files), text, audio files, location coordinates for the historical location points along the tour and links to web content such as You Tube Files or historical references.
Here is a list that we have used: Everything on the list can be directly loaded onto the Page.
- Page photos. Each historic location has its own Page.
- Each page can have many
- Photographs, text stories and a unique sound characteristic.
- Links to other web sites
- References, You Tube videos, Fire Videos, etc.
- Jump Page Links
- These are not part of the tour but are pages that contain more detailed information.
- For example, a list of all firefighters since 1872
- Jump Pages (i.e., continuation of text and stories)
- Our app also included:
- Sanborn Fire Maps
- Google Maps Street View References to today’s Location views
- Fire Run Reports for Insurance purposes
- Ledgers
- Crowd-sourced stories and photos, eg. St. Paul church fire and Wheeler House
- Fire House move and building permits.
- Newspaper stories.
- Audio Narratives
- Narratives, with music or characteristic sounds (e.g., horses neighing or trotting).
Instructions for Starting A Tour
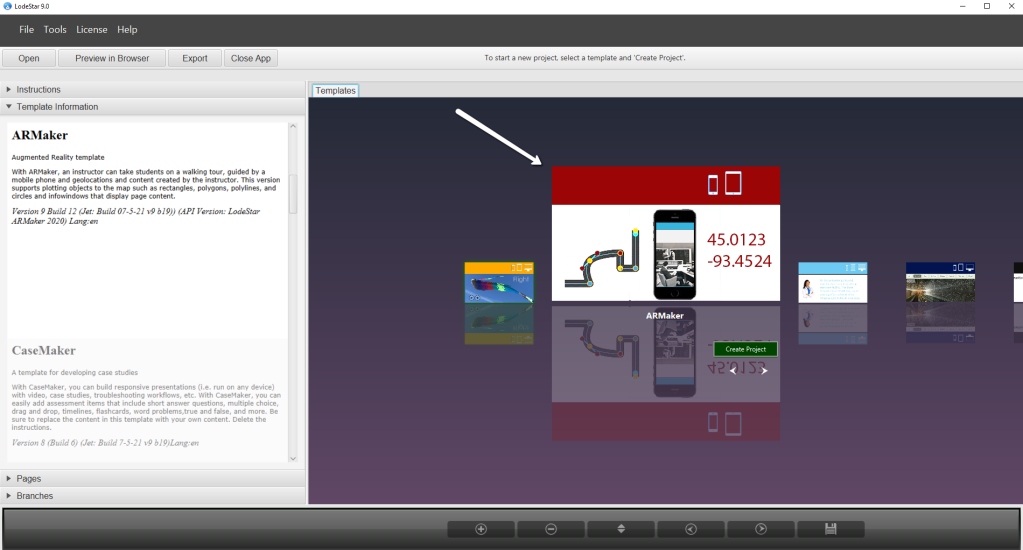
The very first thing is to do after launching LodeStar is to select the “ARMaker” Template. You are prompted to give the Project a name. We used the name “Fire Run Tour”. This project name will show on the top of the work page and is how we find our project in the future as we add content.
The first page comes to our screen and this is where our work begins. The first page is blank at this point. It is a good idea to plan our pages with some uniform format. This applies to background color, font choice, size for various uses and font color. This should not stop anyone from getting started on a project. Lodestar is very flexible and changes are easily made at a later time. Everything we need to get started is on this first page. Hovering your mouse over any of the icons in the tool bar will provide a function description.
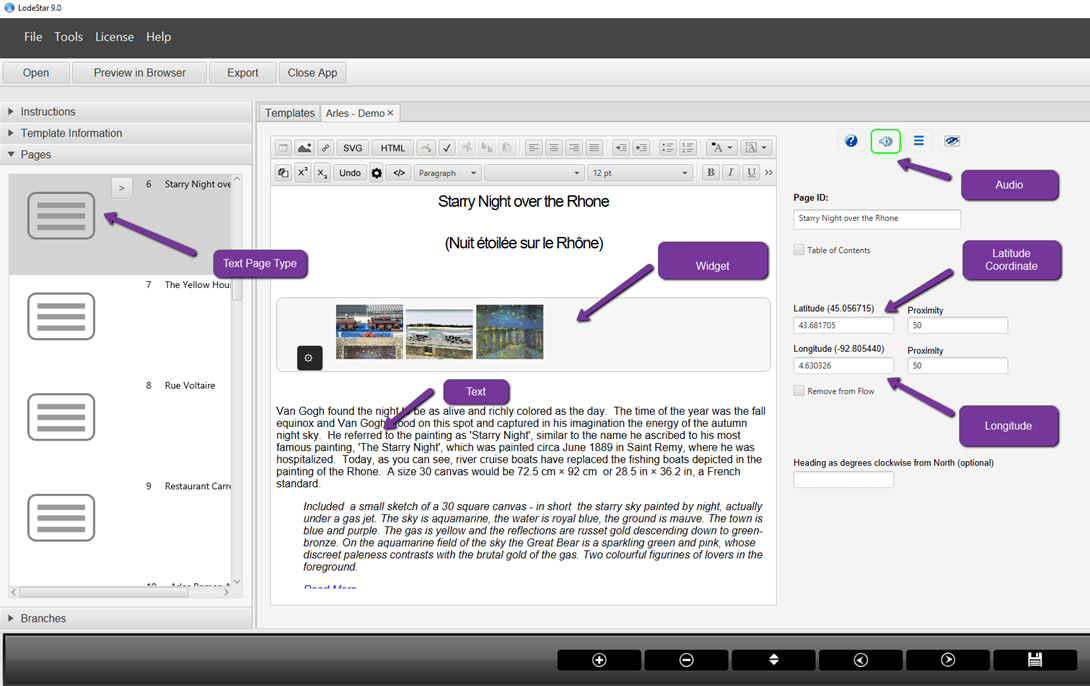
For a given page, we do the photographs first, then the location coordinates, and the text narrative and other stories. The Audio Files (MP3) are generally done last. We used Apple Garage Band to produce our narratives. We used sound files from videvo.net for the music and sound effects.
The latitude and longitude coordinates are sourced from Google Maps for the Fire Run Tour. Precision and detail are important in handling the location coordinates. The negative signs are really important, especially if they are left out. This is a surprise that will help anyone understand navigation better. It is always best to check your work by saving it frequently and displaying it on your browser. Always give each page an id.
A photograph is inserted on a page by clicking on the image icon (for example on page 7 below). This will open up a screen that will help you get the image from your desktop to the LodeStar Page.

This is what the page looks like after you click on the image icon in the above screen.

After changes are made, save your work by clicking on the icon on the lower right of the screen or going to “File” then click on “Save”. It is always a good idea to take a look and see what our changes look like on our browser. This is especially important when we make changes in the GPS Coordinates or Ranges. (We have made a lot of errors with these little gremlins). In our case we just click on the “Preview in Browser” button.
If we have many photographs on a Page, it may be a good idea to put them in a “Carousel”. We do this by going to the black gear-shaped icon and opening a series of “Widgets”, one of which would be the Image Slider or, as I call it, the “Carousel”. There are other interesting “Widgets” to explore for our reading pleasure. Among them would be the “Geolocation” widget, which is what we used for making the map pathway for the tour and the map ranges.
In the Fire Run Tour of Stillwater, we use many links. Some links show how important horses were to the early fire departments. Our links are all highlighted texts.
A particularly good set of tools are the Sanborn Fire Maps, which not only were a good resource for fires and details on Fire Departments, but were made for countless cities across the United States during the time periods between the 1880-1920’s. The maps were all hand drawn and showed a top down view of cities along with the dimensions and specific details of all the various buildings in cities like Stillwater. These are treasured pieces of history that are available to the public from the Library of Congress. Newspaper articles were sourced from the Digital Newspaper Collection of the Minnesota Historical Society. As a matter of courtesy, it is important to properly acknowledge our sources and provide proper attribution.
As we added new historical locations, we put each on a separate Page. We added Pages by clicking on the “+” (Add Page) button on the tool bar on the bottom of the Page. There are 25 Pages total in the Fire Runs Stillwater project. All Pages can be moved around and placed in a different order at a future time. This means that we do not have to start with the first tour location on the First Page. Just get started! For safety and legal reasons, our first pages feature instructions, safety tips and helpful hints. Below is an example of Page 6.

How are “Background Tiles” done for the Tour?
Background tiles are the images that appear behind all the Page images. They only appear in the browser screens. The tiles give the Pages a sense of dimension and frame the tour with a familiar appearance. We have found it best to use historic maps as background tiles, or drawings of one of the story themes. In the Fire Run Tour of Stillwater, we used the formal photograph of the old fire station showing the horses and early equipment and firefighters. Have some fun with this one!
After we selected a photo to be used as a tile, we placed it on our desktop, then opened the LodeStar file with our project name. We then picked a page and next opened the “Tools” icon then selected “Layouts”. The picture below shows the Page file and where the “Layout Manager” screen appears along with some simple instructions.

After we have selected our background tile photo and saved everything, we see a small thumbnail of the tile on the bottom left of the Layout Manager screen. The only way we can view the background tile is on our Browser, so it is important to click “Save” and then click on the “Preview in Browser” button. The screen view below is how your browser screen will look. Notice the background image and the shadow around the main image frame. This background image will now appear behind all Pages on the Tour.

Appearance of Background Tile on Page on the Browser
How are Map Ranges Made?
Map Markers are the pins that are located on the Map. Each will be located by its coordinates and Title. The map pins are sourced from the Page Titles and Coordinates that are inputted when we made each of the Location Pages. This is what appears on the Map Page when it is opened by a user. The title appears when the user hovers over a map pin on the map. It is also an active link that will take the user to that location page when it is clicked.

You do not have to do anything else, and the map pins will appear on the map page when it is opened. The only problem with the map page is that there is a lot of “Map Noise” on the page from commercial locations on the same map. We are doing two things to have our map pins stand out in this noisy environment. The first trick is to create a “Map Range”. This will provide a colored circle around each of the Locations on our tour.
How Do We Make Map Ranges?
These are made by going to the one of the locations on the Fire Run Tour by opening the Fire Runs Stillwater file in Lodestar. Next, we go to one of the Pages. For this example, we have chosen the Page, “First Fire Station in Stillwater”. On this page, you will notice the black gear-shaped icon in the tool bar. When you click on this icon, it opens to a series of “Widgets”, one of which is called “Geolocation”. When we click on Geolocation, it opens to the page below:

There are some arrows that identify how we can make the “Range”. There are choices of the color of the circle, the color and transparency of the circle and the radius of the circle. There also are two boxes for inputting the GPS Coordinates that locate the center of the range. It should be the same as the coordinates used for the page, itself. After you have finished inputting the other items, click on “Add”, then you will need to scroll to the bottom of this page and click on “OK”, then “Save”. At this point, it is always a good idea to click on “Preview in Browser” and see how the changes look in the Browser view.

On the Fire Run Tour, we are using map pins that are red in color along with a transparent red circle that provides a range for the location on the map. We have created a more distinctive page map by adding the ranges and colors to the map.
How Do We Make Polylines (Pathways for Tours)?
The second way we create a distinction in our map is to add “Polylines”. Polylines are the routes that get patrons to the various locations on the map. They show a broad picture of the extent of the tour and provide a pathway for users. We have had some interesting experiences with making polylines. It is sometimes helpful to show everyone the wrong way to do something so that it becomes more memorable. This will be the example that we serve up for this occasion. Just like the previous example, our starting point is the ”Widgets” icon that is on a page. Again, we will go to the Geolocation button and open that page just like in the previous example. This time we will change the option at the top of the Activity Widgets page and change the option at the top left of the page to “Polylines”. This time, instead of entering only one set of latitudes and longitudes, we are entering many sets. These sets of coordinates mark points between which we create a transparent, colored “Polyline”. They usually create a pathway along a street or trail. This is how the completed polyline should look on a browser.

This involves a considerable amount of detail and precision. It is not for the faint of heart, because all this detail invites considerable error and loss of attention. For example, it took six sets of coordinates in a specific order to draw the polyline above. From our experience, all of these latitudes and longitudes look the same after thirty minutes of work. It is easy to make errors. The best advice to anyone is to use the “Preview to Browser” button every time you add a new location or make a change.
If you forget to put the minus sign on the longitude coordinate, you might be interested to know that your new polyline map will take you to Mongolia, somewhere near the Chinese border. This will show up on your map (see the map below where the two lines head north to Mongolia) but it is not likely anyone will take the tour. On the other hand, it does make global geography/navigation kind of interesting.

Staging and Going Live
Staging and going live with the Tour APP is done frequently while developing the tour. We do this to get a feel for how the tour is performing when we use our mobile devices. We do this live, but do not publish the APP links to the public. Sometimes we hide the link somewhere on our web site until we are ready to go public. We are generally making changes, adding content, adding locations, correcting copy, changing coordinates or making the geo-fence ranges smaller or larger for each location on the tour.
Our “Staging” for Lens Flare Stillwater has two Levels. The first level involves our sending the files that we developed to our staging person (John Moore). John takes our staged files for the Fire Run Tour of Stillwater and gets them in the proper form for interfacing with the servers that are used.
John Moore is a computer guy. The rest of us know little about code and computers but learn enough from both of them to be somewhat dangerous if left unattended.
What we do when we stage a tour file is compress the file then save it in a file location. We then move this file to a Dropbox location that is shared by John Moore and me. We generally tell John what we want done to the file as it is sent to the server location. We also ask John to give us an “Address” so that we may go to the site and check its performance after it has been staged. The server service that we use is called “Site 44”. It works well for us, although LodeStar Learning can recommend other services. “Site 44” is a service that interfaces with Dropbox files of Content and Code then sends information to user devices when conditions are met by those who are using the tour site.
Conclusion
So, in summary, we have described our service and what it does and how it works. We also have examples of how we provided content for one of our Pages and how anyone can do something similar using the LodeStar ARMaker template. We have shown how to make our Pages distinctive by using a Tile Layout. We have shown how we use the AR Maker template to make map marker ranges and polylines. Finally, we have shown how we stage our files. If our team of inexperienced users can do this, anyone can do this even better. The LodeStar software is relatively easy to use and has available other features, good Help and Instructions. Enjoy History, get started and have some fun with this great set of tools.
You can experience the Virtual Tour of Stillwater by going to this link to load the Fire Run Tour of Stillwater on any of your devices.
https://lensflareapps.site44.com/fireruns/index.htm
Link for Lens Flare Stillwater web site: Scroll to bottom of Home Page to get links to any of the tours: