
Introduction:
As instructional designers, we understand that technology (even cool technology) can never substitute for the elemental motivations and emotions of a student engaged in a meaningful eLearning interaction. Curiosity, exploration, challenge, suspense, resolution and revelation are all examples of experiences one strives to conjure when designing interactions. Technology alone, once the novelty has worn off, doesn’t cut it. Technology is just a means to an end – what researchers like to call an affordance. Technology affords us the opportunity to create experiences that stimulate curiosity, present challenges and encourage learning. Technology might take the form of videos, animations, audio, elaborate layouts, interactive maps, virtual worlds, and on and on. But if it doesn’t motivate or result in an emotional experience or elicit the triumph of winning a challenge, or an ‘aha’ moment, the technology will soon leave learners cold.
I learned that lesson from a computer game I played in the 80s. It was called Space Quest and it was tremendously fun. The first versions of the game were in black and white with simple graphics. You had to solve a series of challenges to stay alive. Those were addictive. A group of our friends tried to solve the challenges together. When it became too late to play any longer, our friends went home–only to return the next day.
Later versions of Space Quest began using a 256-color palette. The graphics and animation became more colorful but often left you in this passive mode, more like watching a movie than playing an interactive game. The first exposure to new technology was kind of exciting – but then the ‘movies’ lost their appeal.
I think about a very exciting technology, geolocation storytelling, in the same way. The technology is becoming more and more seductive. Interactive maps can now feature 3D buildings, customized maps, and most recently, game objects. You can create 3D models of dinosaurs, for example, and have them suddenly appear when you reach a location – like Central Park. Imagine it: dinosaurs in Central Park or on the Mississippi river, for that matter. As interesting, you can move around in real space, and see your location updated on a fictional map. But what does this all mean to the busy instructor?
The answer is, typically, very little. Certainly, instructors and students can purchase or subscribe to off-the-shelf, ready-made products that use these technologies. The benefits, however, will only outweigh the costs if the technology satisfies a significant instructional goal. Often, there isn’t a good fit and that’s why I am more interested in homespun. I am interested in the instructor as creator and what the instructor can create. I am more interested in how instructors can use sophisticated technology simply and get students to explore, complete a challenge or experience that ‘aha’ moment in a manner that precisely matches a course objective.
A simple but effective example
The following example illustrates how instructors can use basic geolocation technology but avoid the pitfalls of spending time without the commensurate return on investment or not getting students to think, solve problems, explore or experience a new insight or gain a new perspective. You will need to use your imagination on how the underlying principle applies to your situation.
The example will show how you can draw on a map and relate that to content that will help students solve a problem.
The example is inspired by Blue Zones, places where people live longer. Blue Zones was developed by Dan Buettner whose work (e.g. AfricaQuest, MayaQuest, Blue Zones, etc.) typically fosters the experiences that I’m discussing: curiosity, exploration, decision-making, and problem-solving. Visit https://www.bluezones.com/ for more information on his latest project.
To make our example come alive, I’ll choose two of the original five blue zones: Okinawa, Japan and Sardinia, Italy. In a real application, I would choose five or more locations. Our objective is to get students to visit the sites, look around with the help of Google Street View, collect statistics, compare and contrast the information and then propose a theory of why people live longer in these zones. Dan Buettner, of course, summarizes this information in his books, but in our hypothetical application, we want students to think for themselves.
Herein lies the crux of our strategy. We could simply present the information. The geolocation technology would then serve as another form of page turner. If, instead, we get students to explore, collect data and attempt to solve a problem, we have caused students to think and experience firsthand the thrill of discovery.
Please note that we’ve covered geolocation storytelling in the past. If you’re not familiar with this technology, I encourage you to visit the links below:
Geolocation Storytelling: Van Gogh in Arles (an application)
https://www.oercommons.org/courses/vincent-van-gogh-s-arles/view
Geolocation Storytelling: Van Gogh in Arles (a mobile app)
https://apps.apple.com/us/app/van-gogh-in-arles/id1489831732?ls=1
Geolocation Storytelling: Van Gogh in Arles (an article) https://lodestarlearn.wordpress.com/2019/11/07/geolocation-storytelling-van-gogh-in-arles/
Geolocation Storytelling (an article)
https://lodestarlearn.wordpress.com/2017/05/14/geo-location-storytelling/
The Van Gogh in Arles applications supports students’ visiting Arles and discovering the places where Vincent Van Gogh lived and worked. It also supports students’ visiting Arles from the comfort of their desks. The example below is more like the latter. Students do not need to visit the location. From their desks, they explore a map, collect information and visit the locations virtually.
How it’s done
So, let’s use the LodeStar eLearning authoring tool to set this up step by step. (Full disclosure: I have been the chief architect of LodeStar and president of LodeStar Learning for the past two decades. LodeStar Learning offers a free trial of this tool at https://www.lodestarlearning.com so that you can immediately start a geolocation project. )
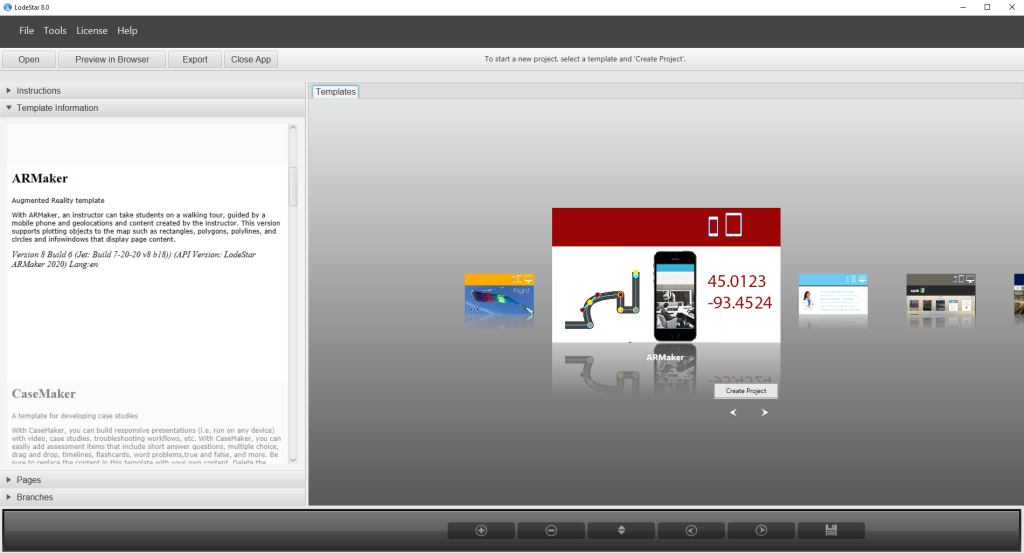
For this application I chose the ARMaker template. The ARMaker template is geolocation aware. The technology is baked right into the template.
Typically in geolocation applications, one would type in a latitude and longitude of a location and then organize the page with text, graphics, imagery, audio and/or video. When the student visits the location or, optionally, clicks on its marker on the map, the student is presented with the content.

In our application, we don’t want students jumping from the map into the content. Rather, we want the content to display on the map.
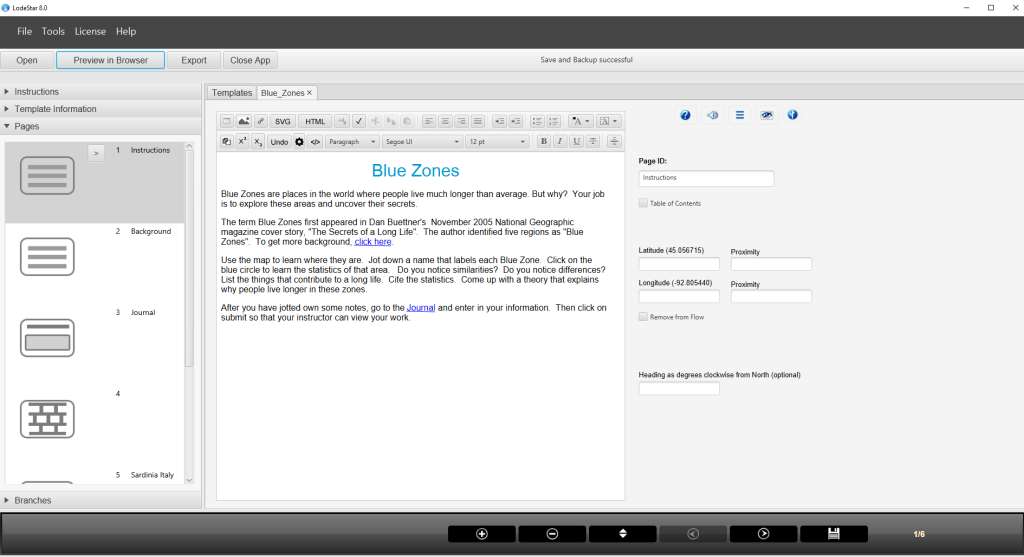
In other words, our first page features instructions, but the instructions are not associated with a latitude or longitude. Because these instructions are on the first page, they display when the application launches.
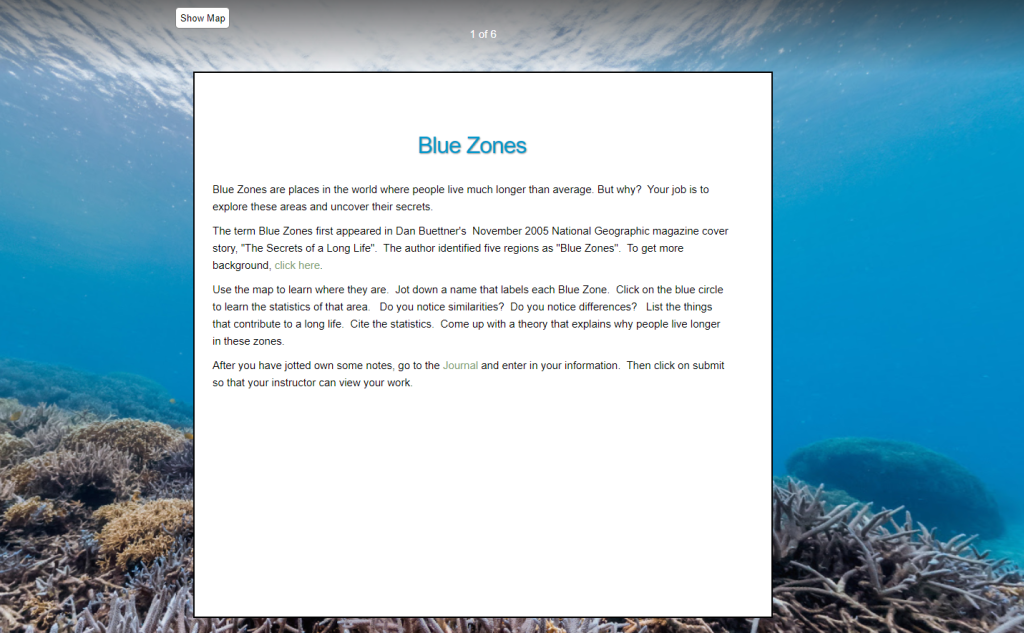
So, after I chose a layout, a theme, and a background image, our application looks like this when I preview it in a browser.
The astute LodeStar user will immediately notice some things are different. I used Tools > Layouts to change the layout and background image. I used Tools > Project settings to make other changes.
In Tools > Project Settings, I hid the navigation buttons; I allowed students to see the map; and I disabled students’ clicking on a marker to jump from map to content.
Here is where a different approach comes in. The ‘Branches’ view and screenshot below begin to reveal the strategy. I add a page with more background detail and link to it. In LodeStar, any text on a Text page can link to any other page. When students click on the words ‘click here’, they are taken to an information page.
I also linked to a Long Answer page. That is where students will input their findings and their theory and submit their work to the instructor.
Also pictured, is a Wall page and two more Text pages on Sardinia and Okinawa. The purpose of the wall is literally to wall off content. Walled off content can only be accessed with a link or a branch or a third method that I’ll soon reveal.

Now here comes the fun part.
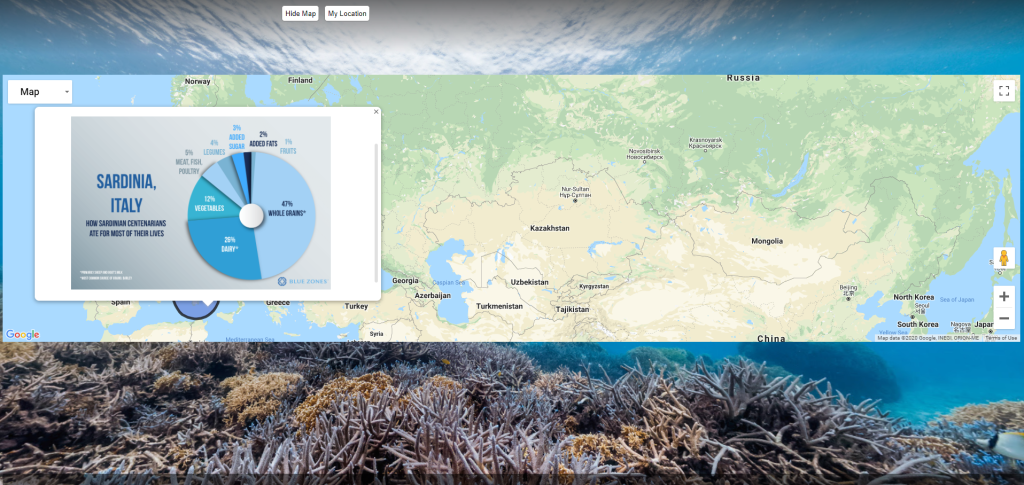
The Okinawa and Sardinia pages feature pie charts created by Blue Zones that show the percentages in an Okinawan or Sardinian diet that are made up of meat, fish, and poultry; legumes; added sugar; added fats; fruits; whole grains; and dairy. In this application, I don’t make any statements. I simply show the percentages. I can also supply other information such as population density, family size, pollution index, climate data, and anything else that will enable students to make educated guesses about what contributes to longevity.
In our application, I’ll mark the Blue Zones. When students click on a blue circle, the data will pop up.
Here is how I set it up:
- First, I added a Geolocation widget to a text page. (LodeStar supports a variety of widgets that can be added to Text pages.)
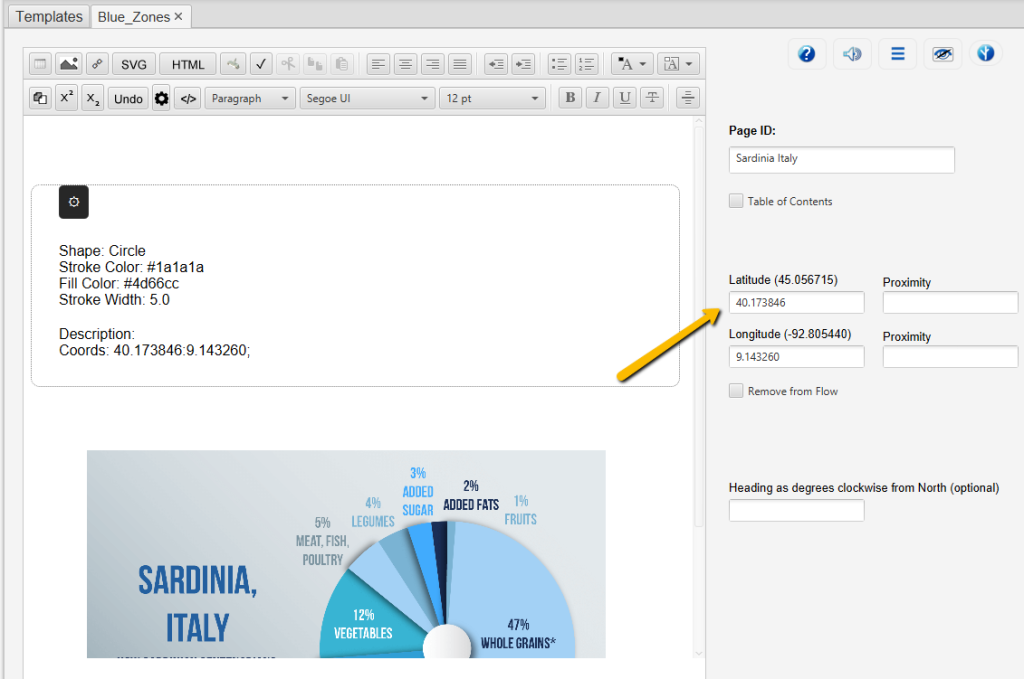
- Second, I added a circle map object and set its properties (stroke color, fill color, radius, etc.) I could also add polygons, polylines, and rectangles.
- Third, I assigned a latitude and longitude to the circle to locate it on the map.
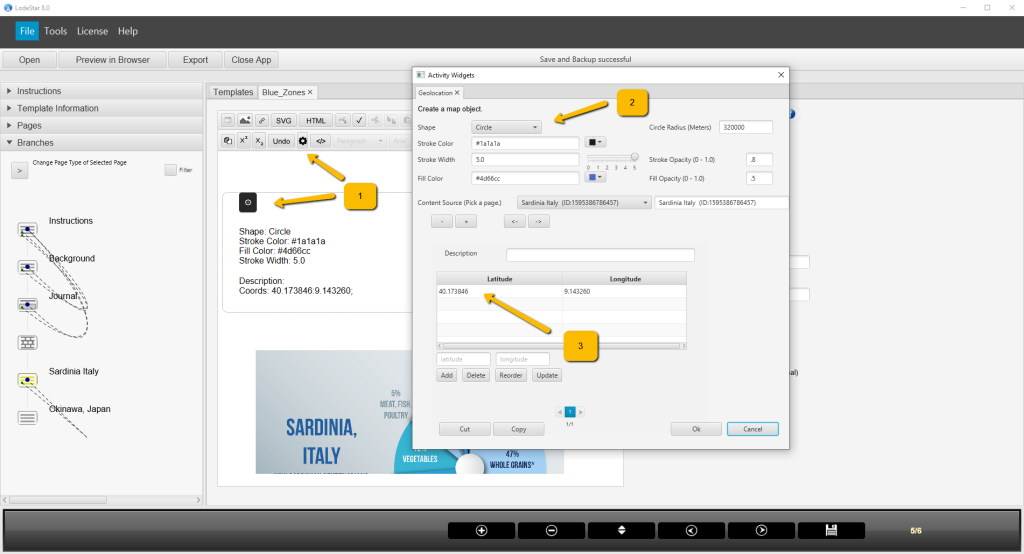
- Finally, I associated a click on the circle to content. The content could be housed on any page and not only the page that houses the Geolocation widget.

As pictured below, I also added latitude and longitude coordinates to the page. This was not absolutely necessary. Adding the coordinates at the page level (rather than the widget level) causes the red markers to display. In Tools > Project Settings, I disabled the markers. Their only function is to set the bounds of the map. In our example, the markers conveniently set the boundaries around Okinawa and Sardinia.
(In normal geolocation applications, you would create content on a page and then set the latitude and longitude to mark the location on the map. As I’ve mentioned, when students click on the marker or walk near the location, they are transported to the page.)
Here is what it looks like when the student clicks on ‘Show Map’.
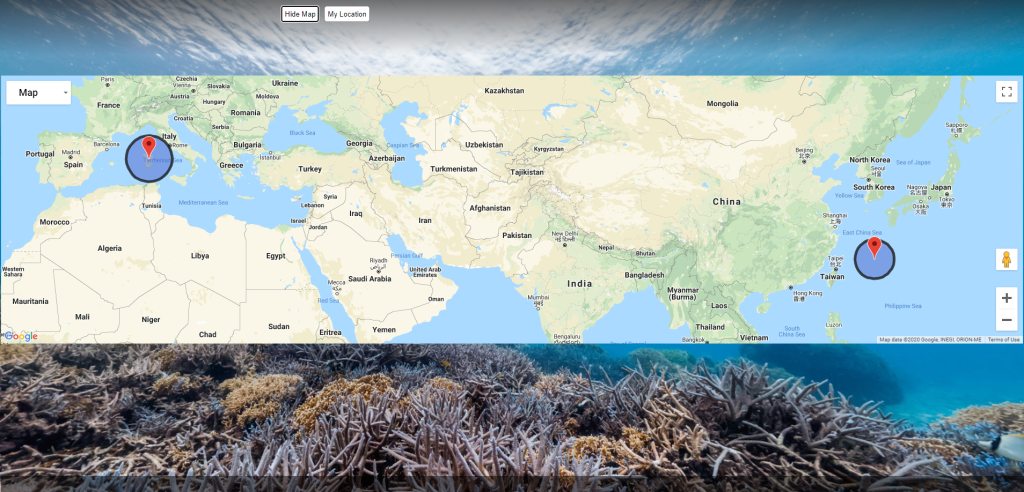
Here is what it looks like, when the student clicks on a blue circle (i.e. a Blue Zone).
Now to explore further, the student drags the icon over Sardinia, and gets this:

The student has landed into a ‘street’ view of Sardinia and can look around. Observant students will notice the water, the fishing boat, and the uneven terrain – all of which relate to factors that contribute to long life.
Once the student has made her observations and drawn some conclusions, she can submit her information to the instructor with the help of the long answer page.
Conclusion
One could easily imagine an application that simply displays the Blue Zones on a map with information on each site. Our hypothetical application gives students something to do. We challenge students to solve the mystery of long life that challenged Dan Buettner and the demographers Gianni Pes and Michel Poulain before him. To present students with this challenge, we don’t need a degree in computer science or in art or in 3D modeling. We need to boil things down to the essential elements of curiosity, exploration, challenge, suspense, resolution and revelation. An instructor’s efforts should be focused on organizing the background information, the data, the locations and the assignment to make the most out of what this technology affords us as educators. As importantly, we want the technology to bend to our educational objective–and not the other way around.
You can picture using maps, graphical objects and information in your own disciplines. When applications are set up in meaningful, problem-solving contexts in biology, geology, social sciences, history, or whatever, the possibilities are, dare I say, boundless.
