Robert N. Bilyk
President, LodeStar Learning Corporation
I’ve been reading Teaching Machines, The History of Personalized Learning by Audrey Watters1, who may be best known for her “Hack Education” blog. Teaching Machines is a great read. It was published in 2021. Since then, Audrey Watters posted her last on ‘Hack Education’ and, according to her post, no longer writes about Tech Education.
The Past
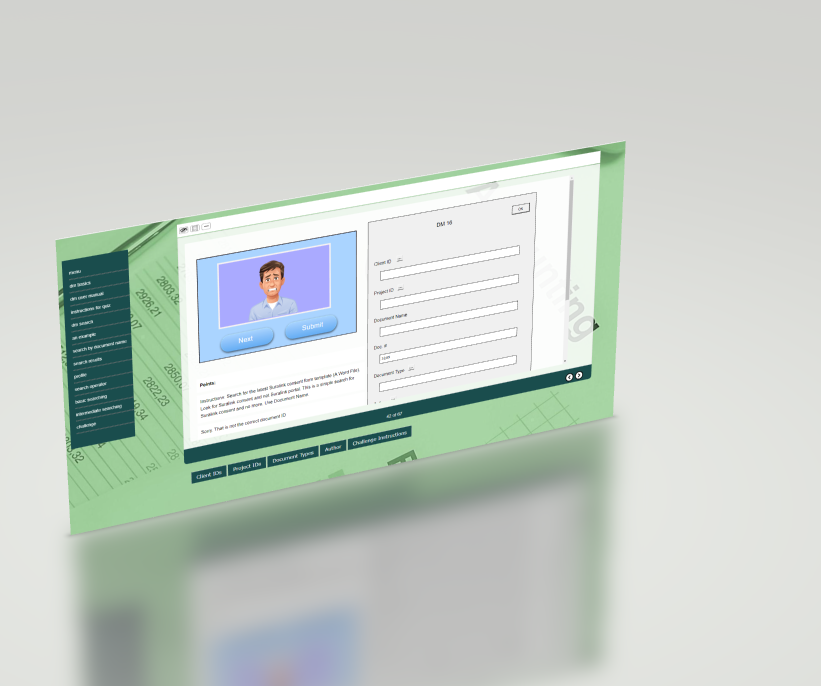
A good part of Teaching Machines is dedicated to B.F. Skinner’s Teaching Machine. By today’s standards, it’s a crude mechanical device. The early versions were wood boxes that displayed questions through a small window and required students to write answers on a paper strip. Once students submitted their answers, they pulled a lever to display the answer and advance the paper strip. The questions and answers were printed on a paper disk partitioned into pie wedges.
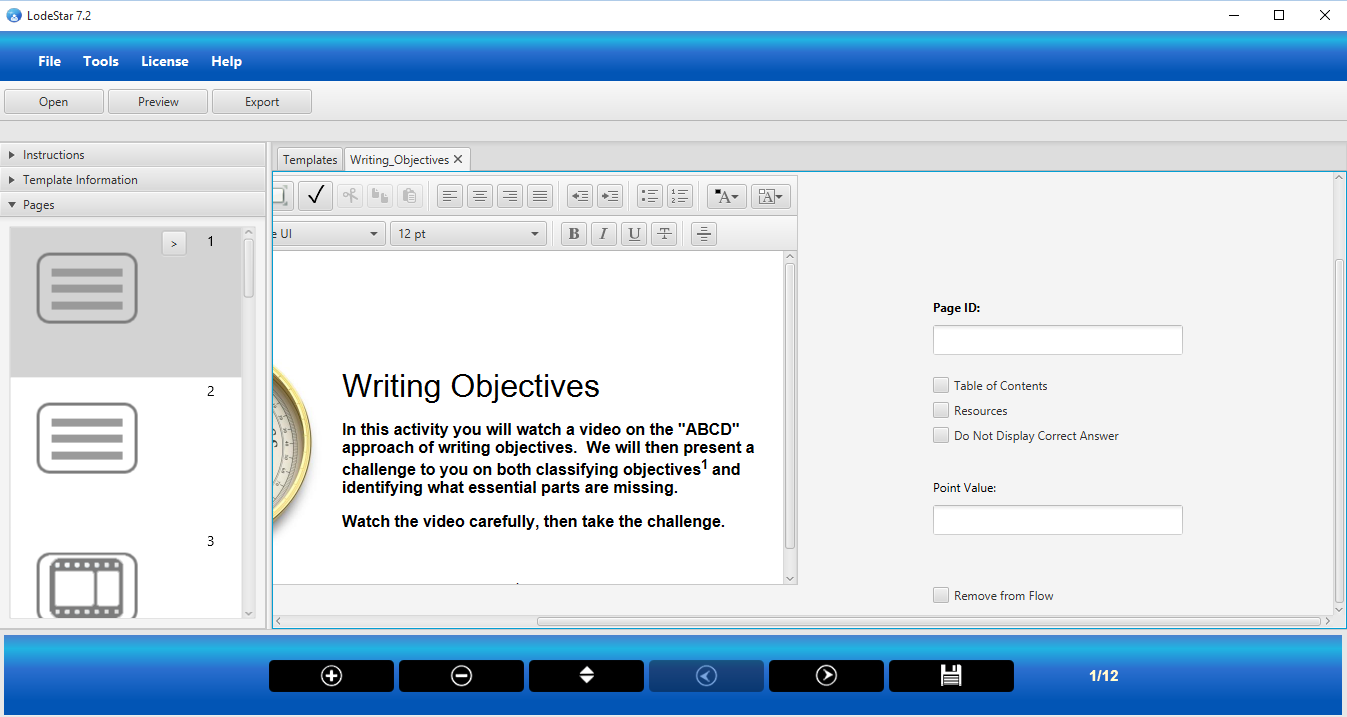
For fun, I simulated an early prototype of B.F. Skinner’s Teaching Machine. I used our LodeStar Authoring tool to simulate how the early machine worked.
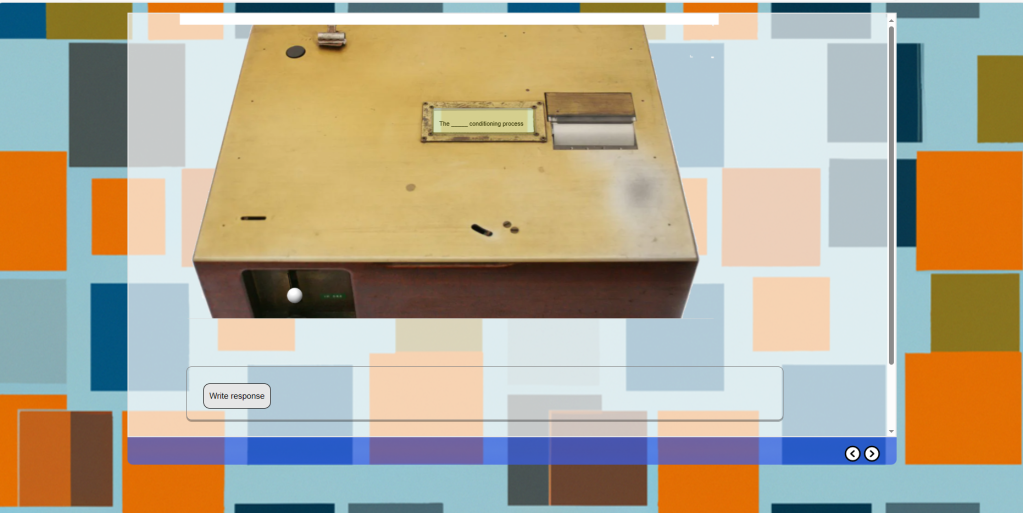
See the simulation at https://lodestarlearning.github.io/Teaching-Machine/index.htm
Films from that era (the 50s) conjure up rows of students working on the machines – a setting not unlike a factory floor with row upon row of workers at their sewing machines.
And yet, as Watters writes, the impetus – the motivation – behind the design of these teaching machines was largely, in the opinion of their inventors, altruistic and intended for the benefit of the student.
Watters recalls how Skinner visited his daughter’s 4th grade math class. The teacher wrote math problems on the board. Some students finished quickly and squirmed in their seats as they waited for the class to progress. Other students struggled to complete the problem and perhaps never successfully finished.
Fast forward thirty years. I was a high school language arts teacher in the 80s. One of my classes consisted of students who could not read or write very well. I’ve spoken about this a dozen times. The underlying reasons for their inability to read or write very well had to do with who they were: some students were newly immigrated from non-English speaking countries; other students had learning disabilities; and others hated school. I was handed one curriculum that treated the class as one homogenous body. I really needed materials and strategies that addressed the needs of at least three populations. I needed some form of teaching machine.
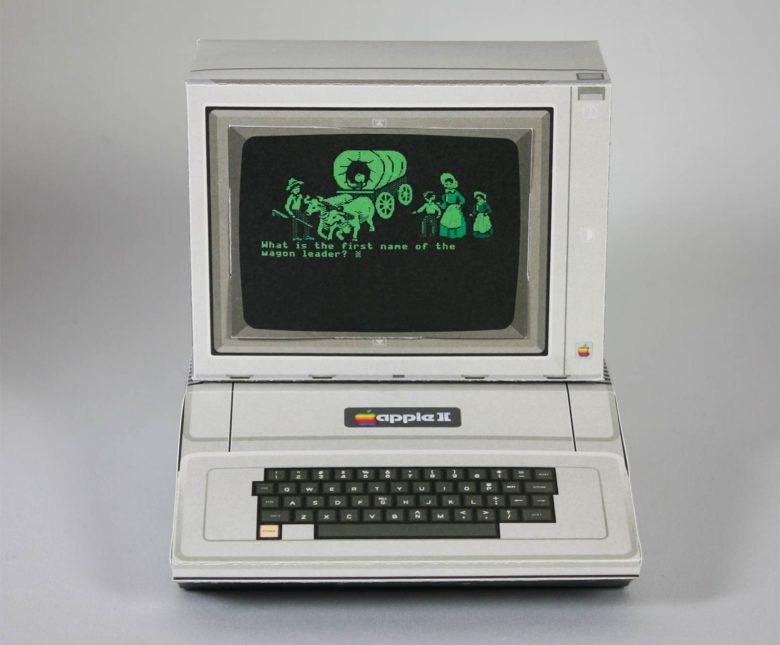
Skinner, in response to his daughter’s class, decried that “something must be done”. I approached our Instructional Materials Center Coordinator and asked if, in any way, the Apple IIe machine in the library could help me ‘individualize’ the instruction. For Skinner, the realization led to his idea of a teaching machine. For me, I began a career-long journey into the world of technology-assisted personalized learning.
From time to time, I’ve challenged myself to take a hard look at the principles that drove my pursuit to help students with technology. As a starting point, I was interested in the following ideas:
For the student:
- Go at your own pace, where the learning objective is constant, but time is variable.
- Get quick feedback.
- Have fun.
- Pursue lesson branches based on your interest, choices and performance.
- Be challenged.
For the instructor:
- Free up time for individualized help.
- Get information on what questions students are consistently getting wrong.
- Inform future lesson plans.
I used computer programs on the Apple IIe, but I wanted to write my own. Several years later, I was headed home on a dark country road, listening to Minnesota Public Radio. I was listening to a story about interactive video discs – and I became smitten. At this point in my career, I worked at a college. I asked my dean (who had a background in instructional systems), what I needed to learn to program interactive discs. He answered, “Learn C”. And so I began my study of both learning theory and computer programming and camped out at their crossroads.
At the University of Minnesota, I studied curriculum and instruction. At Saint Paul College, where I worked, I took classes from programmers who made their living at Unisys, Honeywell and other industries. As I soon discovered, my dean’s advice was both bad and good. It was bad because, by the 90s, one did not need to learn a low-level programming language, like C, to control a video disc player. The TenCore Language Authoring System could do that with a much higher level language (thus easier). It was good because I became proficient at programming and could extend authoring systems with lower-level code. In short, I was never limited by the authoring tool, only by my imagination. Later I worked on teams to design a content management system, several instructional products and two authoring systems.
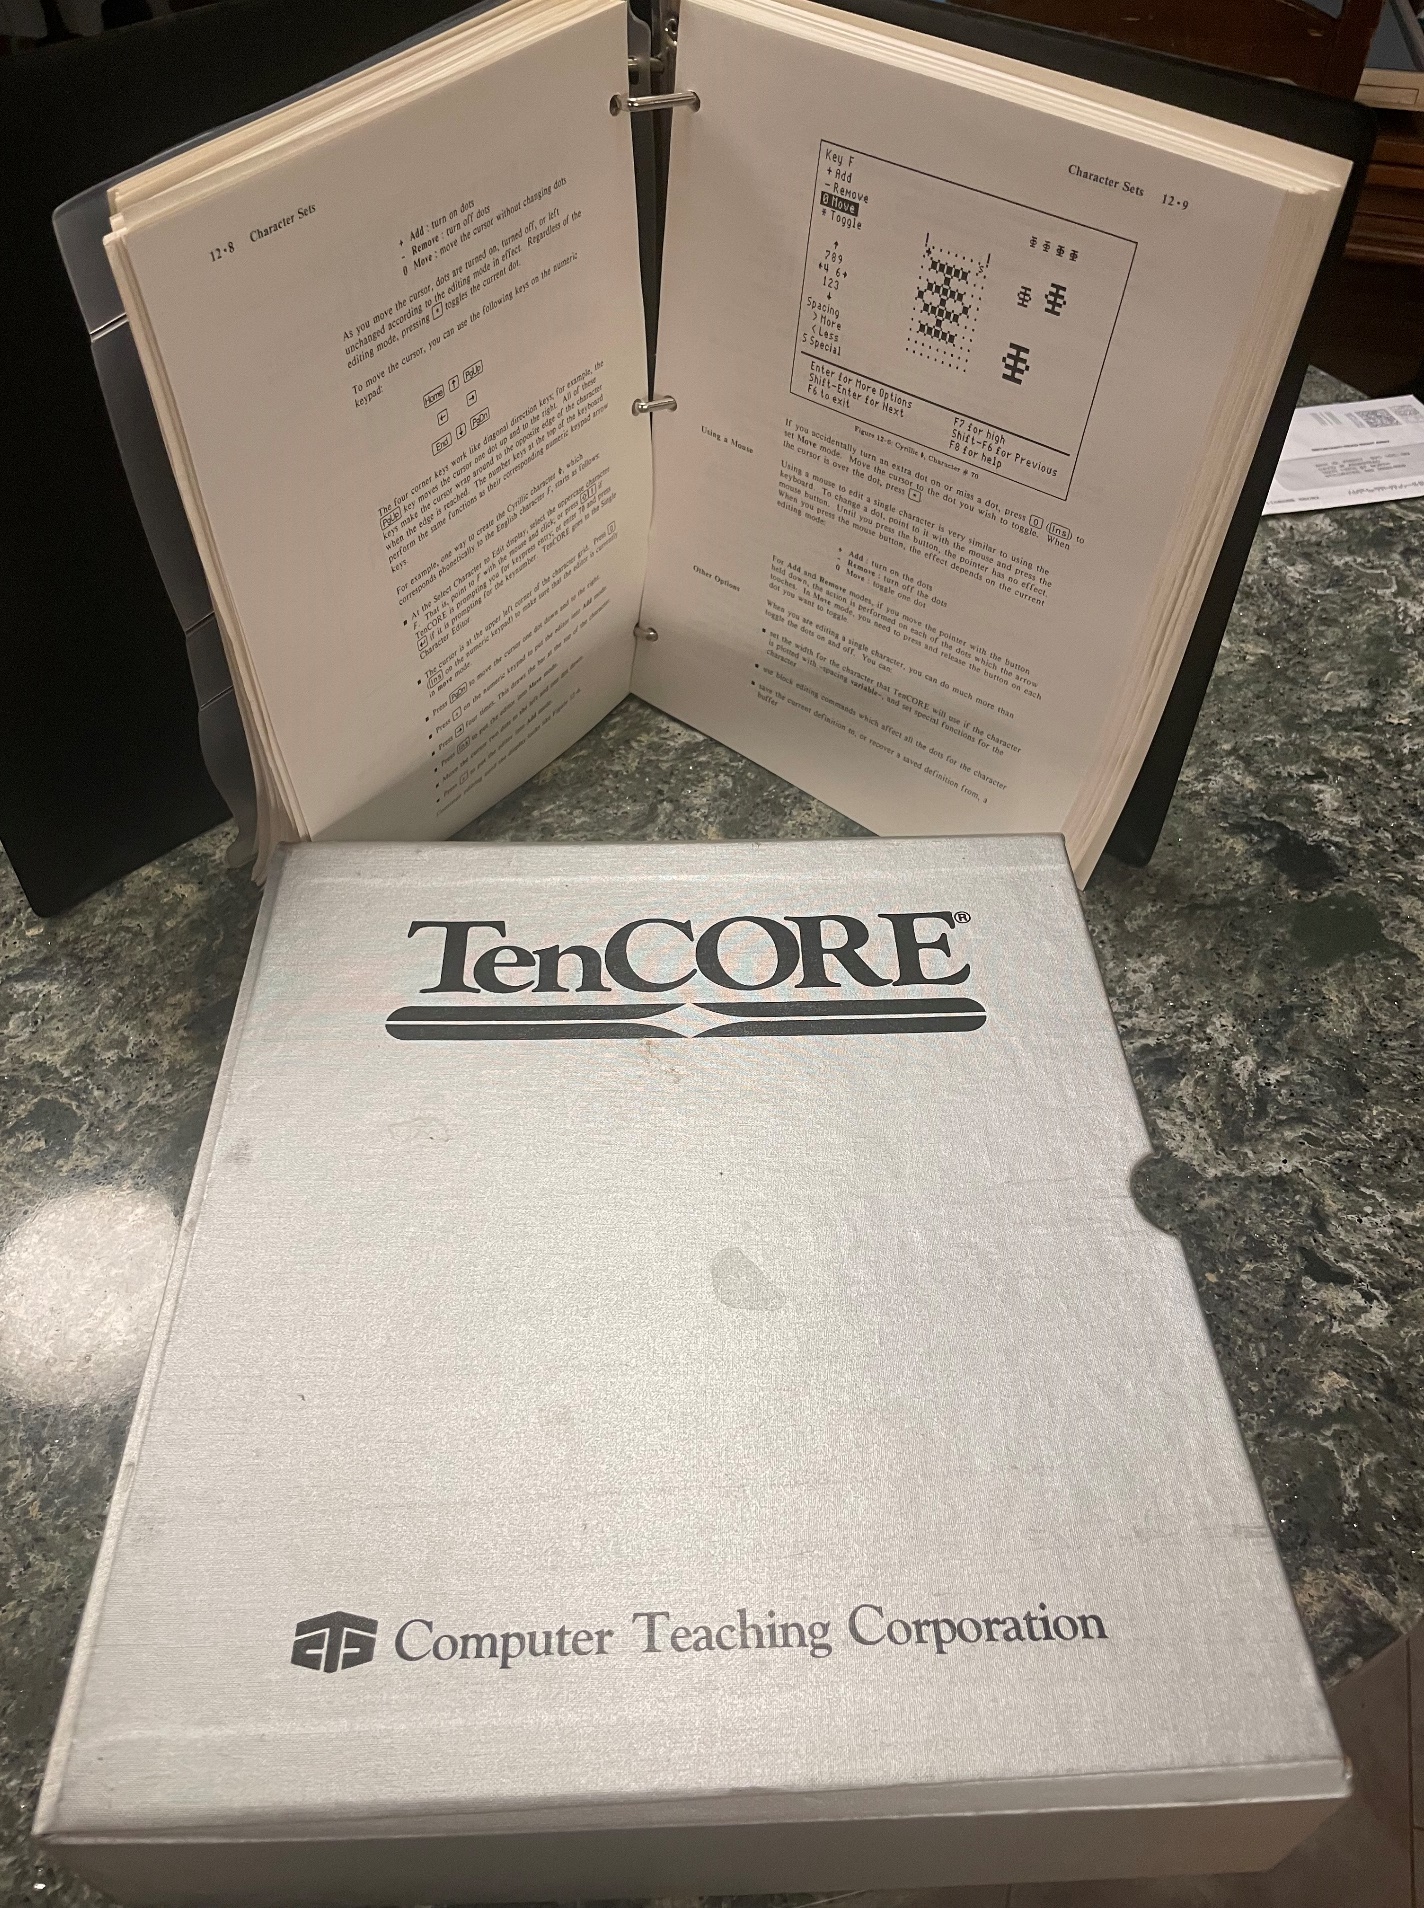
was a TUTOR (PLATO) derivative developed by Paul Tenczar
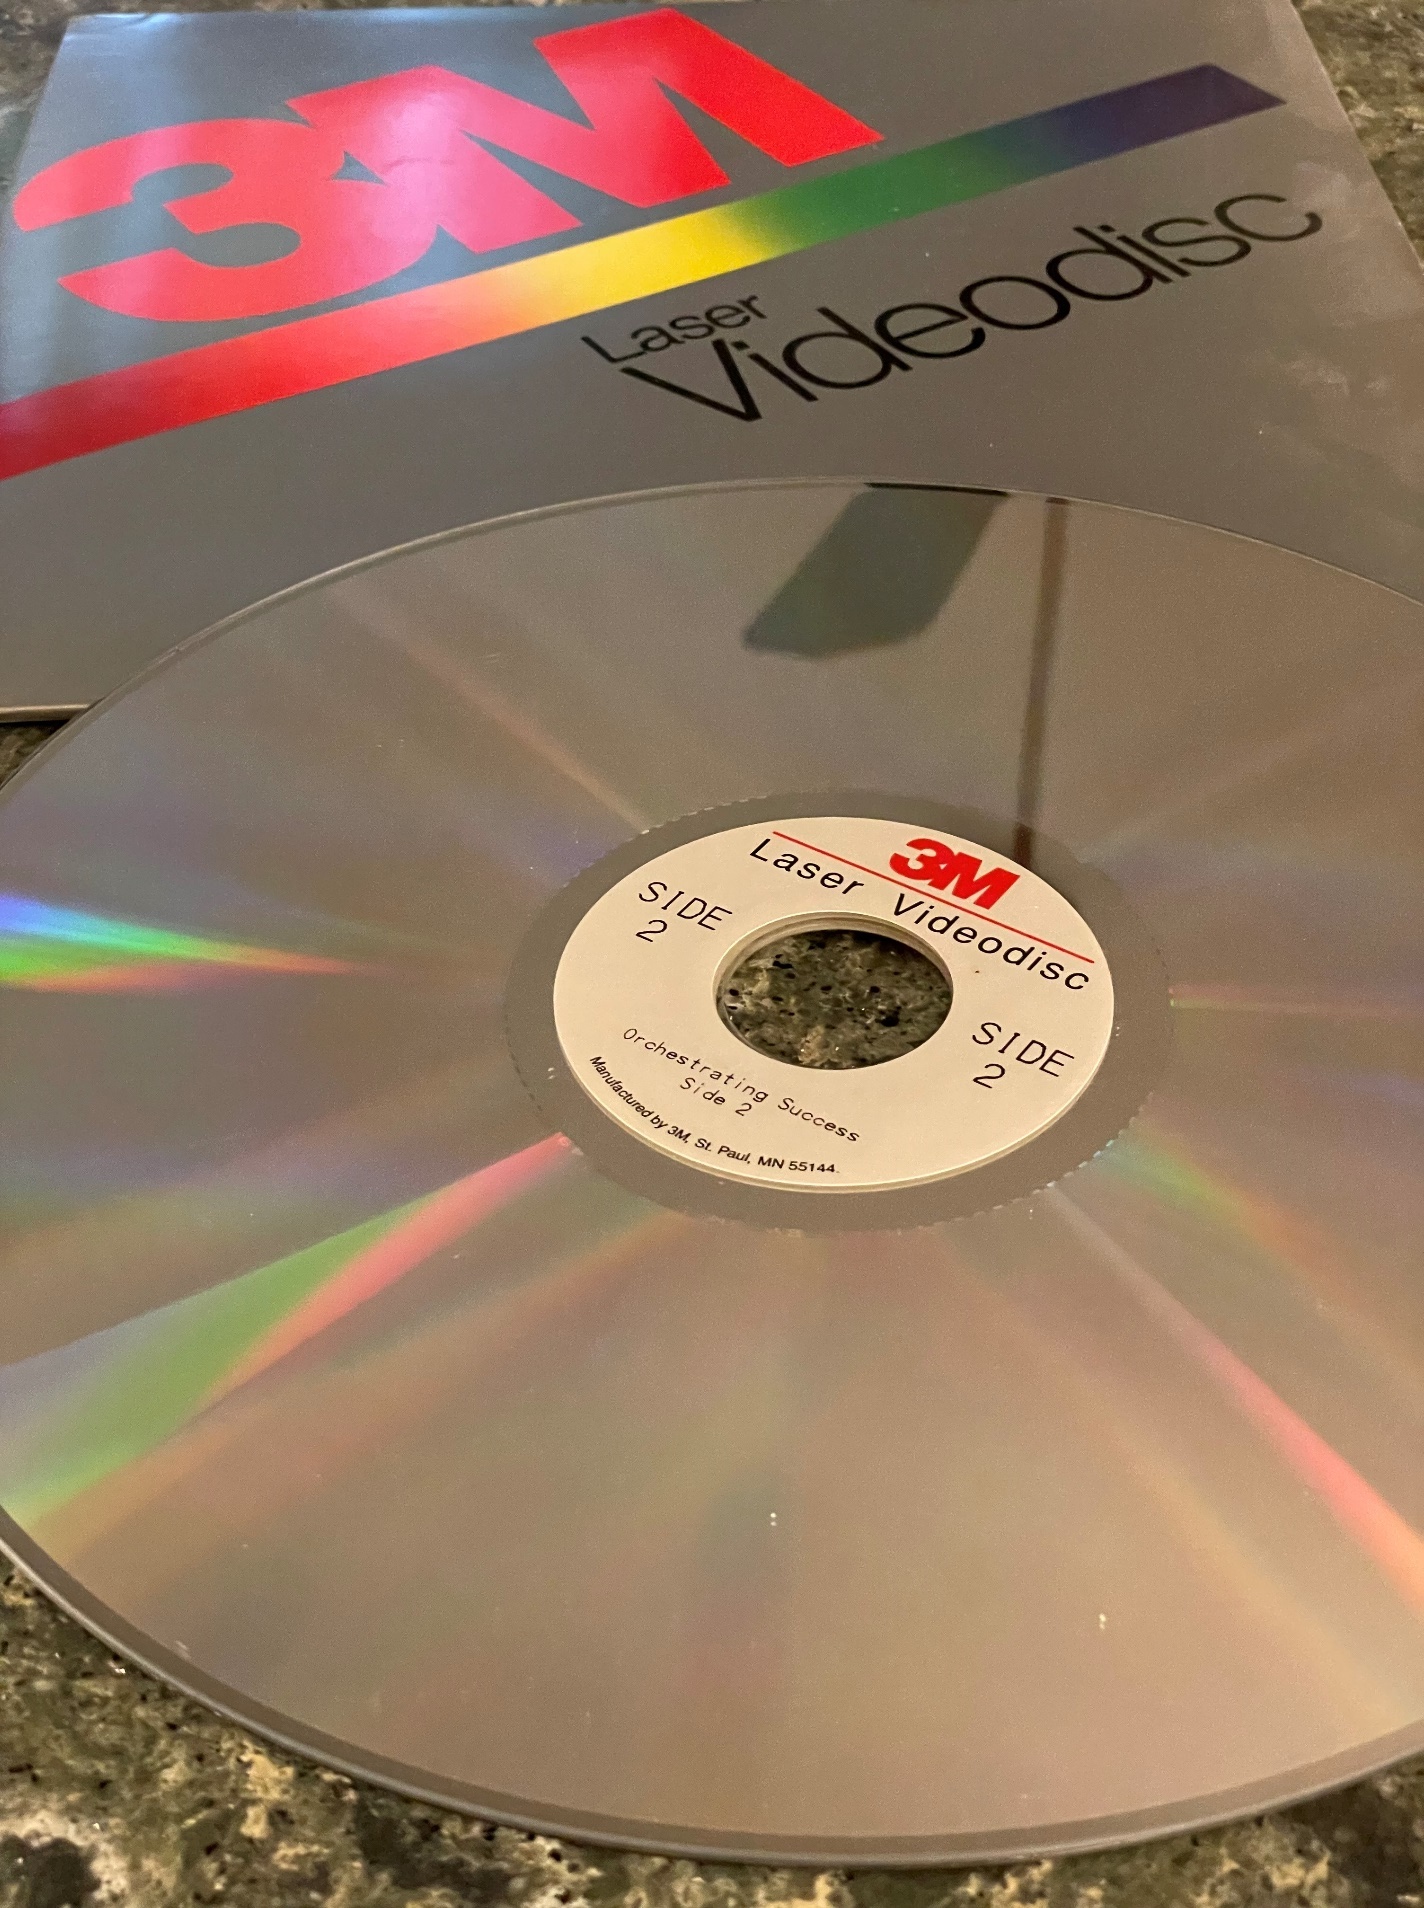
Authoring systems like TenCore, Authorware and Toolbook enabled designers to program the computer to send commands to the player via serial communications.
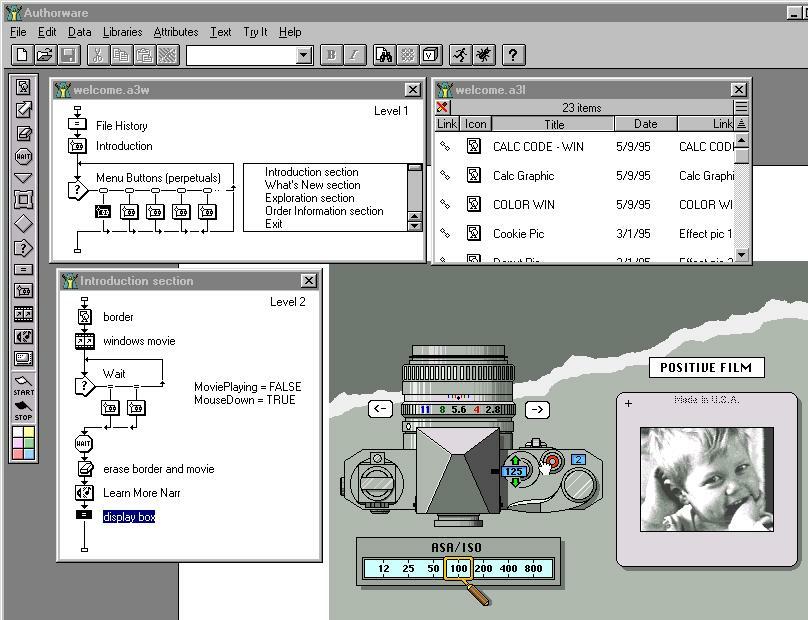
In the early 90s, the University of Minnesota introduced me to Course of Action, which was later renamed Authorware. Authorware was a game-changer. With this system, I could finally efficiently realize all the ideas I had started out with and that now took the form of:
- Individualized instruction
- Immediate feedback, or strategically delayed feedback, based on the design.
- Fun interaction with analog video, high-fidelity sound, dithered graphics (256 color displays), three-dimensional animation (yes, in the early 90s), simulations, games….
- Branched, non-linear instruction.
- Data collection and reporting. (The installed computer program could gather data and, using an early standard from the aviation industry (AICC), report it to the instructor.)
It was a great start and a step toward the present.
The Present
The promise of personalized instruction is partially realized today. Our current teaching machines are programmed by smart authoring systems that can present and control media, animate, branch instruction, simulate real-world conditions in various degrees of fidelity, and report student performance through standards like SCORM, xAPI and CMI5. We also have virtual reality, which can immerse learners in some ‘real-world’ or imaginary context, and augmented reality, which can add a digital layer over one’s interaction with the physical world.
We also benefit from gamification, adaptive learning, learning experience platforms, learning management systems, microlearning, digital story-telling, three-dimensional graphics, and 360 imagery and video. In short, Teaching Machines have come a long way from questions displayed in a tiny window.
And yet there is still something significantly missing that would have benefited both Skinner’s daughter and my high school students…or any learner.
The Future
When it comes to the future, I’m on thin ice. I offer this up more as an invitation to hear from others who have greater insights than I. There is so much happening in academia, industry and in academic-commercial partnerships that I’m just not aware of. But I’ll briefly touch on what has been nagging me for years – and return to this theme in a later post with, perhaps, your contributions.
The problem, in my view, is in the finiteness of our present- day teaching machines. As an example, years ago, my colleagues put out a math series on interactive video disc, then later on CDROM, and then later on the web. The lessons were well presented and followed by numerous exercises in various topics like college-level algebra.
I observed students working through the math programs in Saint Paul College’s Instructional Technology Center. If students didn’t ‘get it’ from the presentation or the exercise feedback, they had little recourse. Fortunately, in some settings, a qualified instructor would then take over and help the student with a different tactic. I observed settings, however, where similar programs were being used but with underqualified tutors. If the students didn’t comprehend the lesson, that was the end of the line. The lab monitor was unable to help them.
A lot of topics rely on a student’s prior knowledge, which may or may not be present. In short, prerequisite skills.
Several years ago, a fleet of‘adaptive learning’ platforms appeared on the market that proposed to remedy this short-coming. (examples of adaptive learning systems include CogBooks, Acrobatiq, Knewton). A lot of investment and effort went into assessing student’s performance and confidence with the subject matter and providing alternative instruction. Some of the platforms catalogued open educational resources and used, what they called, semantic engines to match students with open resources to help them.
Adaptive learning systems are software platforms that optimize the content to adjust for the learner’s goals and current state of knowledge. They are designed to address challenges such as slow pace, difficulty, lack of practice, and insufficient mastery of content. In traditional e-learning courses, students linearly follow the path an instructor creates. They watch videos, read articles, take quizzes, and practice interactive modules often in a predetermined order. An adaptive learning system contains the same types of material but the order, pacing, and content may change for each learner. The system decides which content to show the learner based on the learner’s goal, performance and confidence level. If the system determines the current path is too easy for the learner, it can branch to more challenging material. If it finds out the current path is too difficult, it may intervene and review prerequisite content, reduce the challenge, or slow down the pace.
Most of these systems are proprietary and operate through subscription or a pay wall. Presumably, students who use them benefit from them but the modern teaching machine (i.e., authoring systems, Learning management systems, learner experience platforms) needs to tap into the same technology and benefit from open systems.
Work is being done to open-source systems that use such approaches as Bayesian Knowledge Tracing. Bayesian Knowledge Tracing is used in a number of Cognitive Tutoring systems. This approach develops a model of a student’s knowledge in a given domain and constantly updates that model based on the student’s performance. Probability of skill mastery can be computed from the student’s current knowledge and the proposed learning material. Efforts are underway to use these systems to link learning management systems with open content repositories.
A possibility in the future is that the entire web becomes the new teaching machine. In the past, several concepts and specifications rose and fell in popularity. We may see their renaissance. One concept was Tim Berners-Lee’s Semantic web.
The goal of the semantic web as it relates to education is to make content on the web machine readable – and therefore categorizable and discoverable. To support the description of educational resources several specifications exist including the Resource Description Framework, and the Web Ontology Language.
A recently published article titled ‘Investigating the potential of the semantic web for education: Exploring Wikidata as a learning platform’2 explores the application of the semantic web in academic pursuits.
In short, if one could accurately describe educational content (which may reside in an open educational repository), then authoring tools, Learning Management Systems, adaptive systems, etc. could discover and propose the content to a student who is struggling to achieve an objective.
The key is in an accurate and meaningful description so that its appropriateness can be evaluated for a given student and a given objective.
In the past, we haven’t done well with descriptions, ontologies, taxonomies, metadata and the like. (By we, I mean the teaching profession.) Even the concept of the re-usable learning object (RLO) fell to criticism. A learning object was described by IEEE Learning Object Metadata specification. The LOM standard defined the attributes required to describe learning content. Unfortunately, learning objects were created without adequate descriptions (after all, what was the point?) and their reusability was called into question. In general, it’s possible that content authors don’t have the knowledge or the means to properly describe their content in a way that is meaningful to authoring, tutoring or adaptive systems.
The game-changer will probably be machine learning. Blogs have been filled with examples of how artificial intelligence has supported content generation. Another important use of AI will be to scan and describe open learning content.
For fun, I asked ChatGPT to parse some educational content on an electrical circuit and then provide me with a description that followed both the Resource Description Framework and then IEEE Learning Object Metadata. I then asked ChatGPT to come up with its own machine-readable schema that included keywords and reading level. The simple schema (markup in XML) is shown in the appendix.
Conclusion:
In my view, to personalize learning, the future Teaching Machine needs to tap into the World Wide Web as a resource to shore up prerequisite knowledge needed to achieve an educational objective. The systems can’t be proprietary. They must be open and available to a variety of platforms through an application programming interface (API). The platforms include authoring systems like LodeStar eLearning authoring system, Captivate, and Storyline as well as learning experience platforms, adaptive learning systems, cognitive tutors and learning management systems.
As importantly, the resources should remain in their repositories, but still report performance to a learning management system or learning experience platform. That is now possible through standards like CMI5, but — as I’ve lamented in the past — few learning management systems support CMI5.
The teaching machine began with limited content printed on paper disks. It progressed to include all of the affordances of the modern computer. Its future promise might lie in open standards that connect learner needs to appropriate content scattered across the globe.
References
1Watters, A. (2021). Teaching machines the history of personalized learning. The MIT Press.
2 Evenstein Sigalov, S., Nachmias, R. Investigating the potential of the semantic web for education: Exploring Wikidata as a learning platform. Educ Inf Technol 28, 12565–12614 (2023). https://doi.org/10.1007/s10639-023-11664-1
Appendix
ChatGPT generated XML schema for a learning resource on electrical fundamentals.
<educational_resource>
<title>Understanding Electrical Fundamentals: Voltage, Current, and Resistance</title>
<keywords>
<keyword>Voltage</keyword>
<keyword>Current</keyword>
<keyword>Resistance</keyword>
<keyword>Electricity</keyword>
<keyword>Electrical Power</keyword>
<keyword>Ohm’s Law</keyword>
<keyword>Circulatory System</keyword>
<keyword>Electrical Concepts</keyword>
</keywords>
<reading_level>High School / Early College</reading_level>
<content>
Just as your heart produces the pressure to make blood circulate, a battery or generator produces the pressure or force to push electrons around a circuit. …..(the remaining content omitted for the sake of brevity)
</content>
</educational_resource>